Figure 2. Effect of microemulsion formulation of tocotrienol (TTE) in various concentrations on the opacity index of galactose-fed rats
during 4 weeks of treatment. All values are mean ± standard deviation (SD; n = 18). ap<0.001 versus normal; bp<0.01 versus vehicle; cp<0.05 versus 0.2% tocotrienol (TTE); dp<0.05 versus 0.1% TTE; ep<0.05 versus 0.05% TTE, fp<0.05 versus 0.02% TTE, gp<0.05 versus 0.01% TTE.
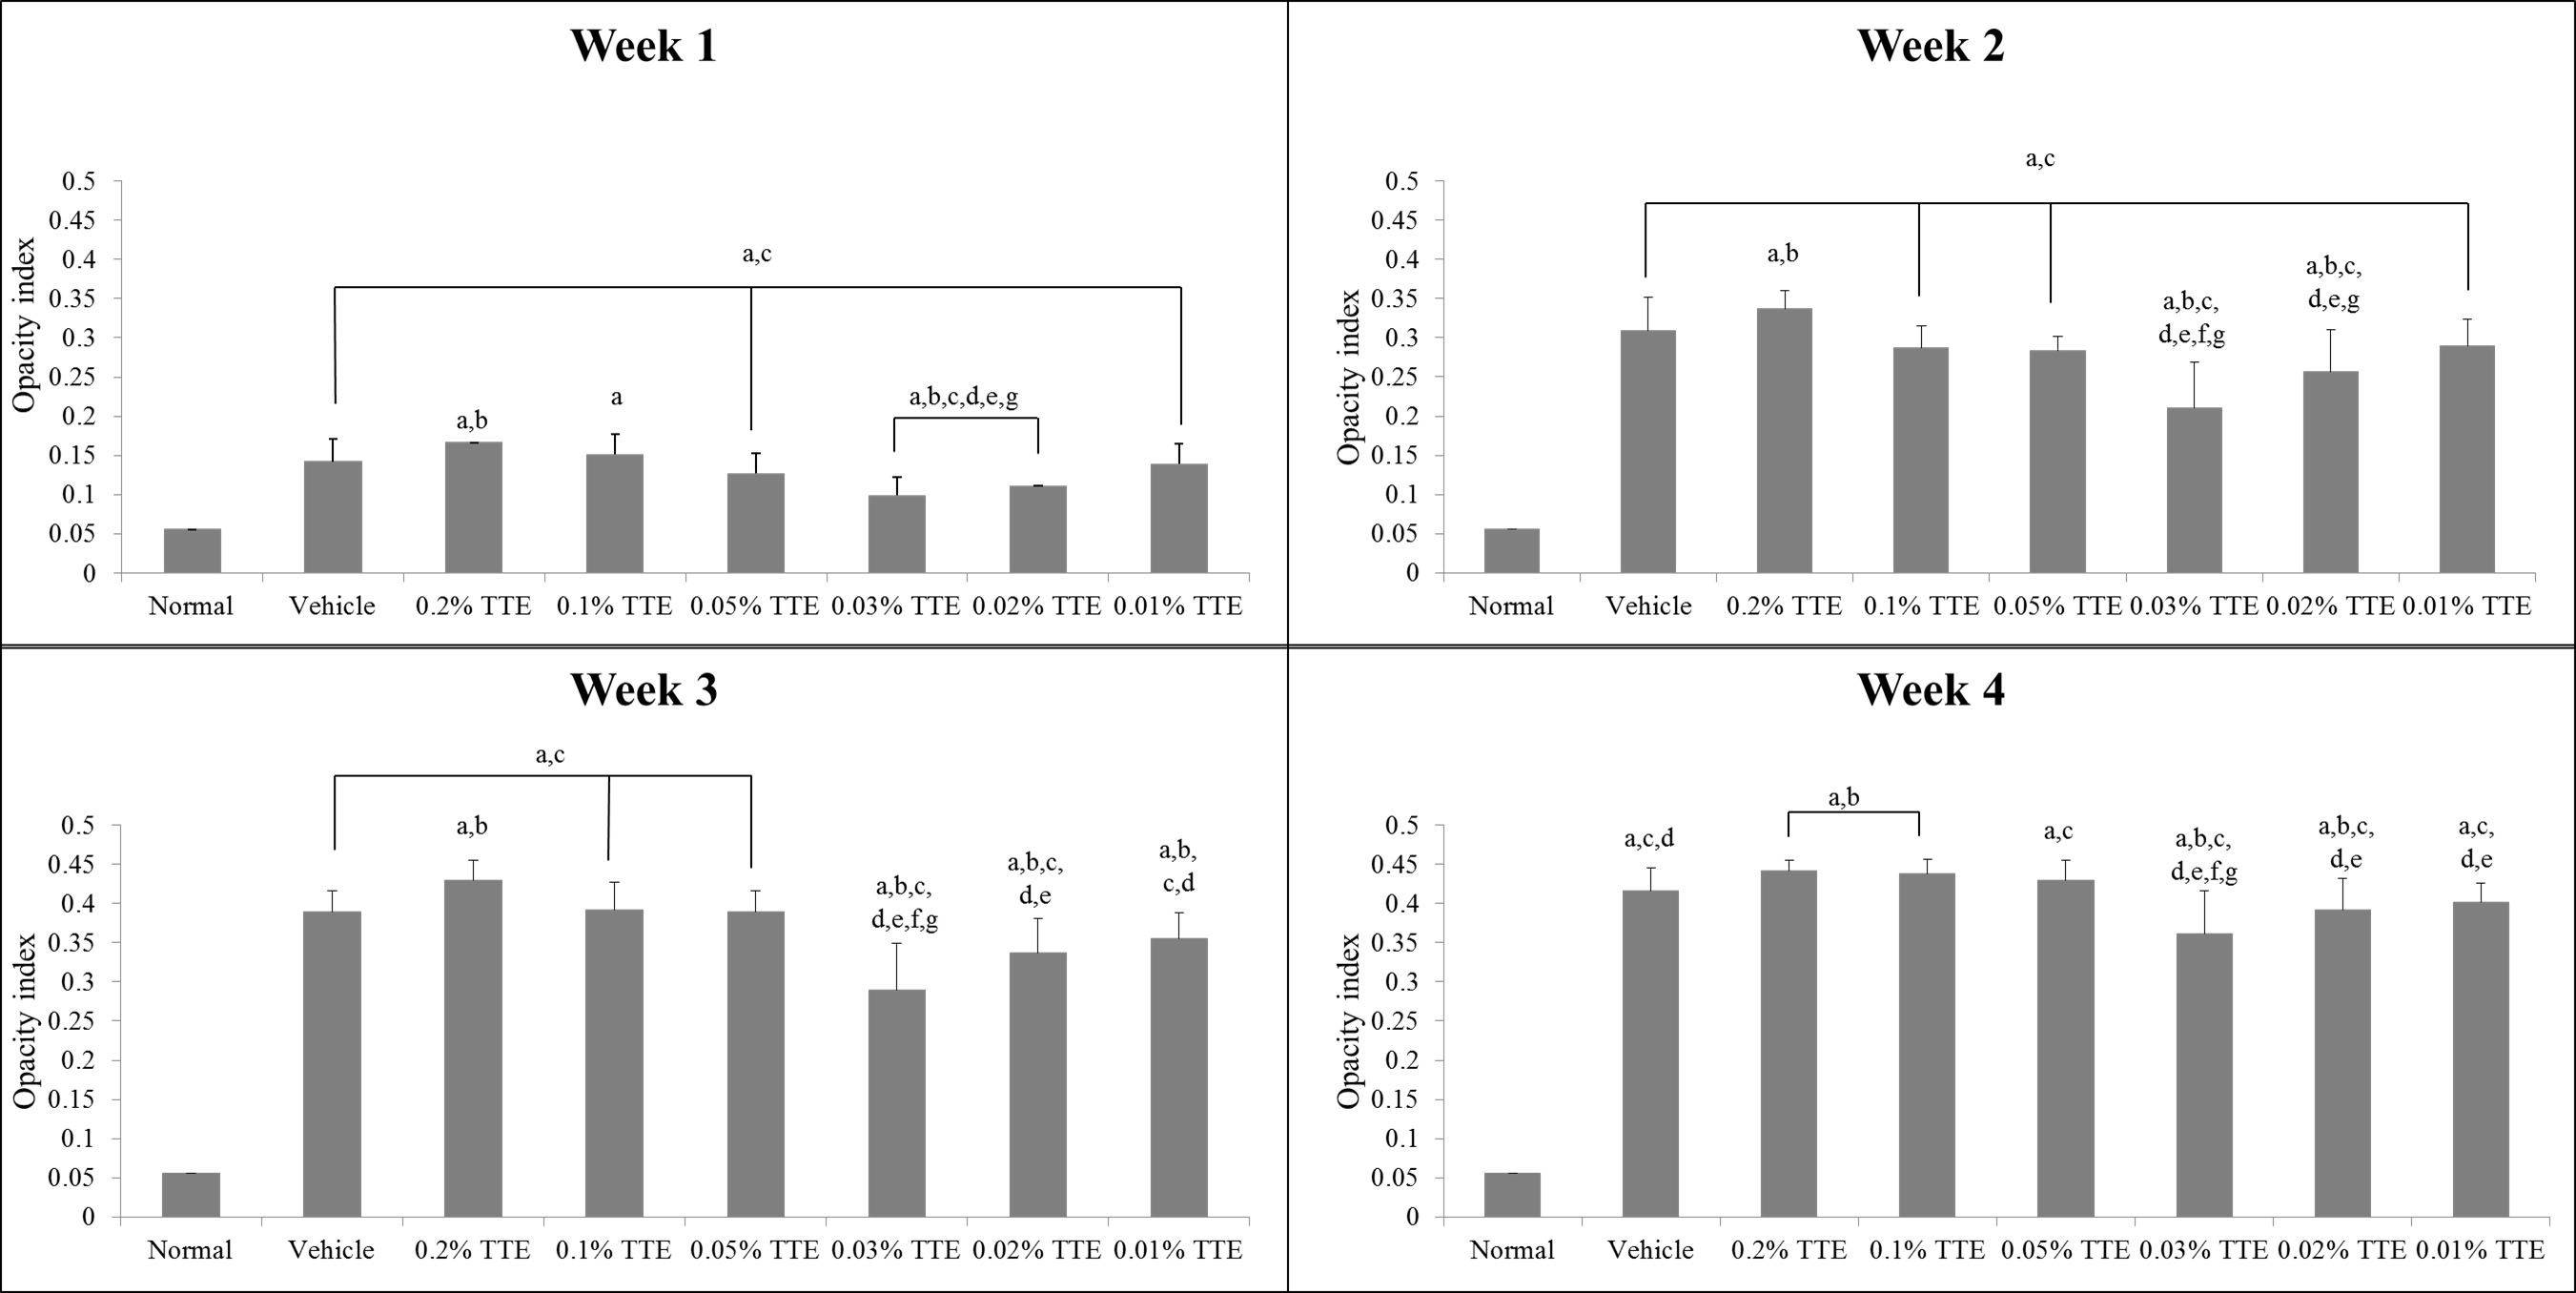
 Figure 2 of
Nasir, Mol Vis 2014; 20:822-835.
Figure 2 of
Nasir, Mol Vis 2014; 20:822-835.