Figure 2. Reverse transcription (RT)–PCR analysis and Sanger sequencing to determine the effect of the mutation on splicing. A: Agarose gel electrophoresis of RT–PCR products. Note, the patient has a 359-bp band, whereas the father has two bands of
443 bp and 359 bp. B: Parts of the sequencing chromatograms of the 443- and 359-bp bands. Note that exon 5 is skipped in the 359-bp band (mutant
allele).
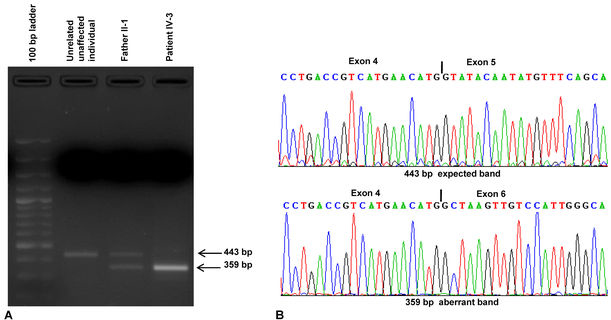
 Figure 2 of
Shah, Mol Vis 2014; 20:790-796.
Figure 2 of
Shah, Mol Vis 2014; 20:790-796.