Figure 1. Primary RPE cells were treated with various concentrations of TNF-α (2, 10, 20, and 100 ng/ml) for 24 h or left untreated.
A: Immunoblot showing tumor necrosis factor (TNF)-α-induced intercellular adhesion molecule-1 (ICAM-1) expression. B: Relative expression of the ICAM-1 protein. C and D: The amount of total vascular endothelial growth factor (VEGF) and VEGF-A165b proteins released from RPE cells into media determined with enzyme-linked immunosorbent assay (ELISA). E: Fluorescent micrographs showing nuclear localization of SRSF1 (red). Nuclei were counterstained with Hoechst (blue). Control
RPE cells showed expression of SRSF1 in the nuclei and in the cytoplasm. TNF-α induced more nuclear localization of SRSF1.
Scale bar = 20 μm.
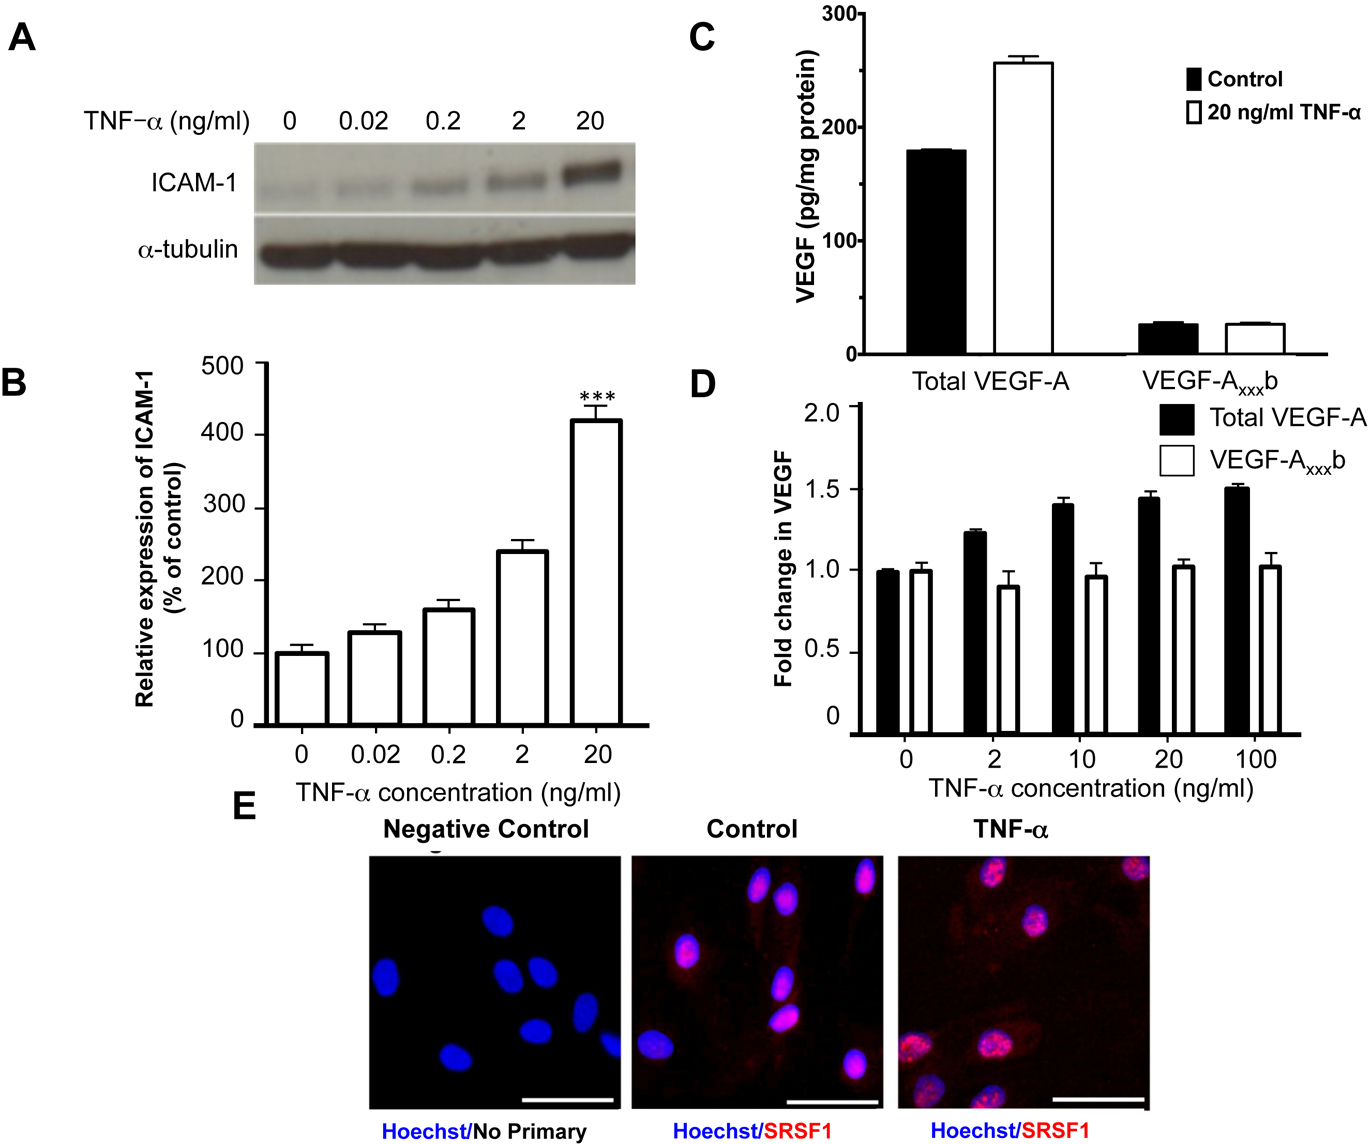
 Figure 1 of
Thichanpiang, Mol Vis 2014; 20:781-789.
Figure 1 of
Thichanpiang, Mol Vis 2014; 20:781-789.