Figure 5. Relative mRNA expression of Nrf2, p62, HO-1, and GSTP1 after 2 h, 6 h, 12 h, and 24 h incubation with 5 µM pinosylvin. Cells
without pinosylvin = 1. Data expressed as the mean relative expression (versus RPLP0)±standard error of the mean (SEM), n
= 3, *p<0.05, significantly different from solvent control (methanol), ANOVA, and the t test.
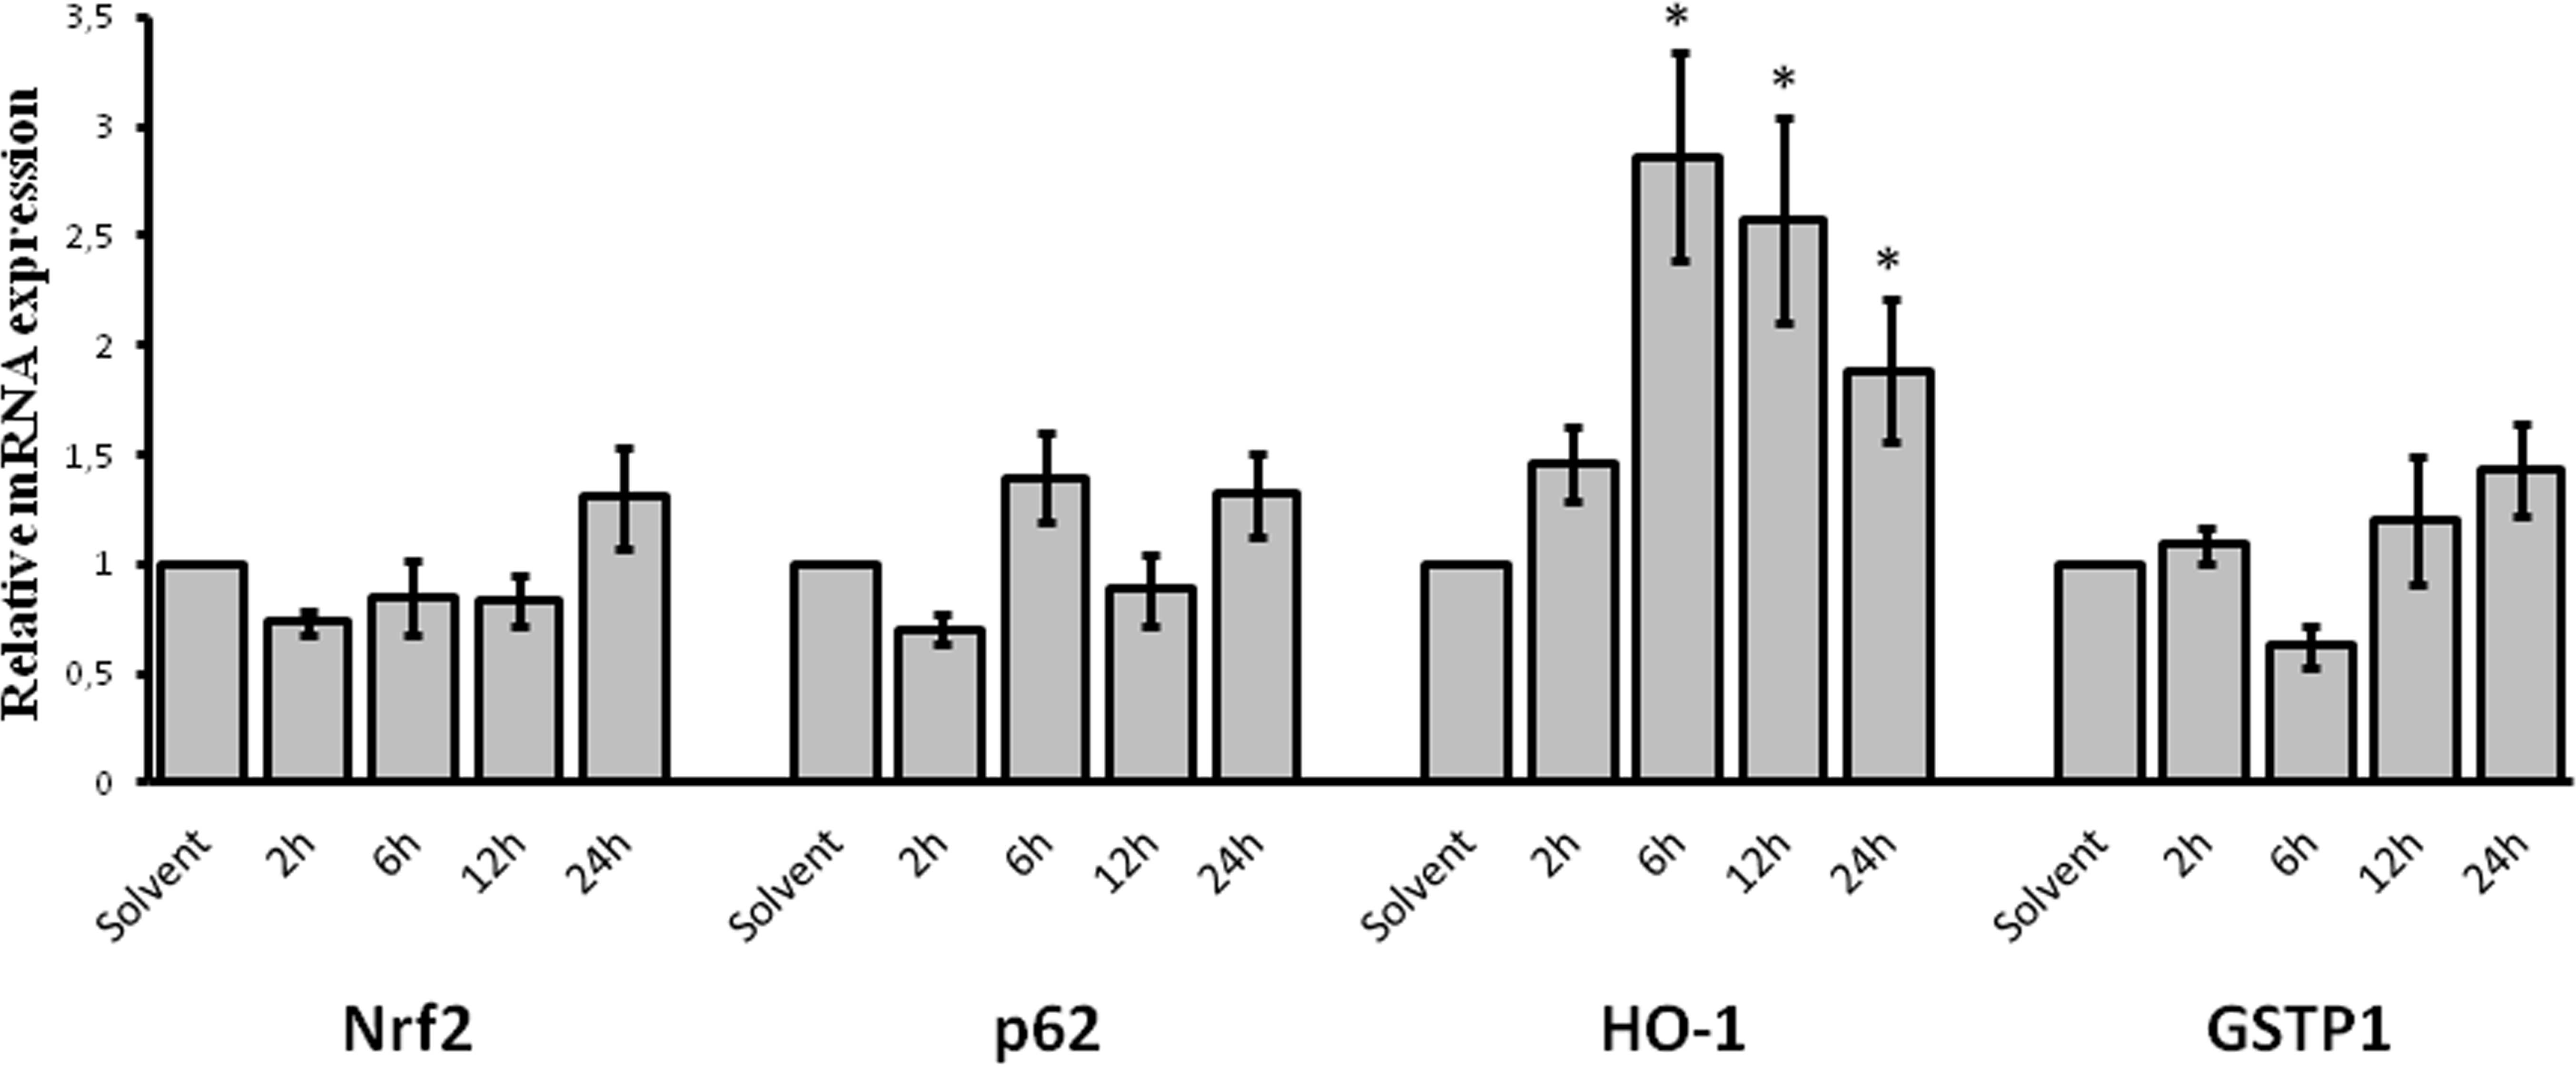
 Figure 5 of
Koskela, Mol Vis 2014; 20:760-769.
Figure 5 of
Koskela, Mol Vis 2014; 20:760-769.