Figure 4. Bioluminescence analysis of Per1-luciferase rat retina explants. A: Detrended bioluminescence recording (black line) from a representative explant cultured under protocol M0. Data were fitted
with a cosine curve (y = y0 + c·cos[2π(t-φ)/τ]) shown in gray, to calculate corresponding periods. B: Detrended bioluminescence recording (black line) from a representative explant cultured under protocol M1. Data were fitted
with a damped cosine curve (in gray; y = y0 + c·exp(-t/d)·cos[2π(t-φ)/τ]) to calculate the oscillation periods. C: Detrended bioluminescence recording (black line) from a representative explant cultured under protocol M2. Data were fitted
with a damped cosine curve (in gray) as in B. D: Composite graph showing averaged traces on the same scale and during three cycles, from samples within each treatment group
(n = 4 for M0, in light gray; n = 4 for M1, in gray; n = 7 for M2, in black). In panels A–D, the alternating rectangles at the top indicate the projection of the lighting schedule (black: 12 h dark; hatched: 12 h
light) to which animals were exposed before they were euthanized. E: Rhythmic power in cultures under protocols M0, M1, and M2. Mean values±standard error of the mean (SEM) are shown. * p<0.05;
*** p<0.001.
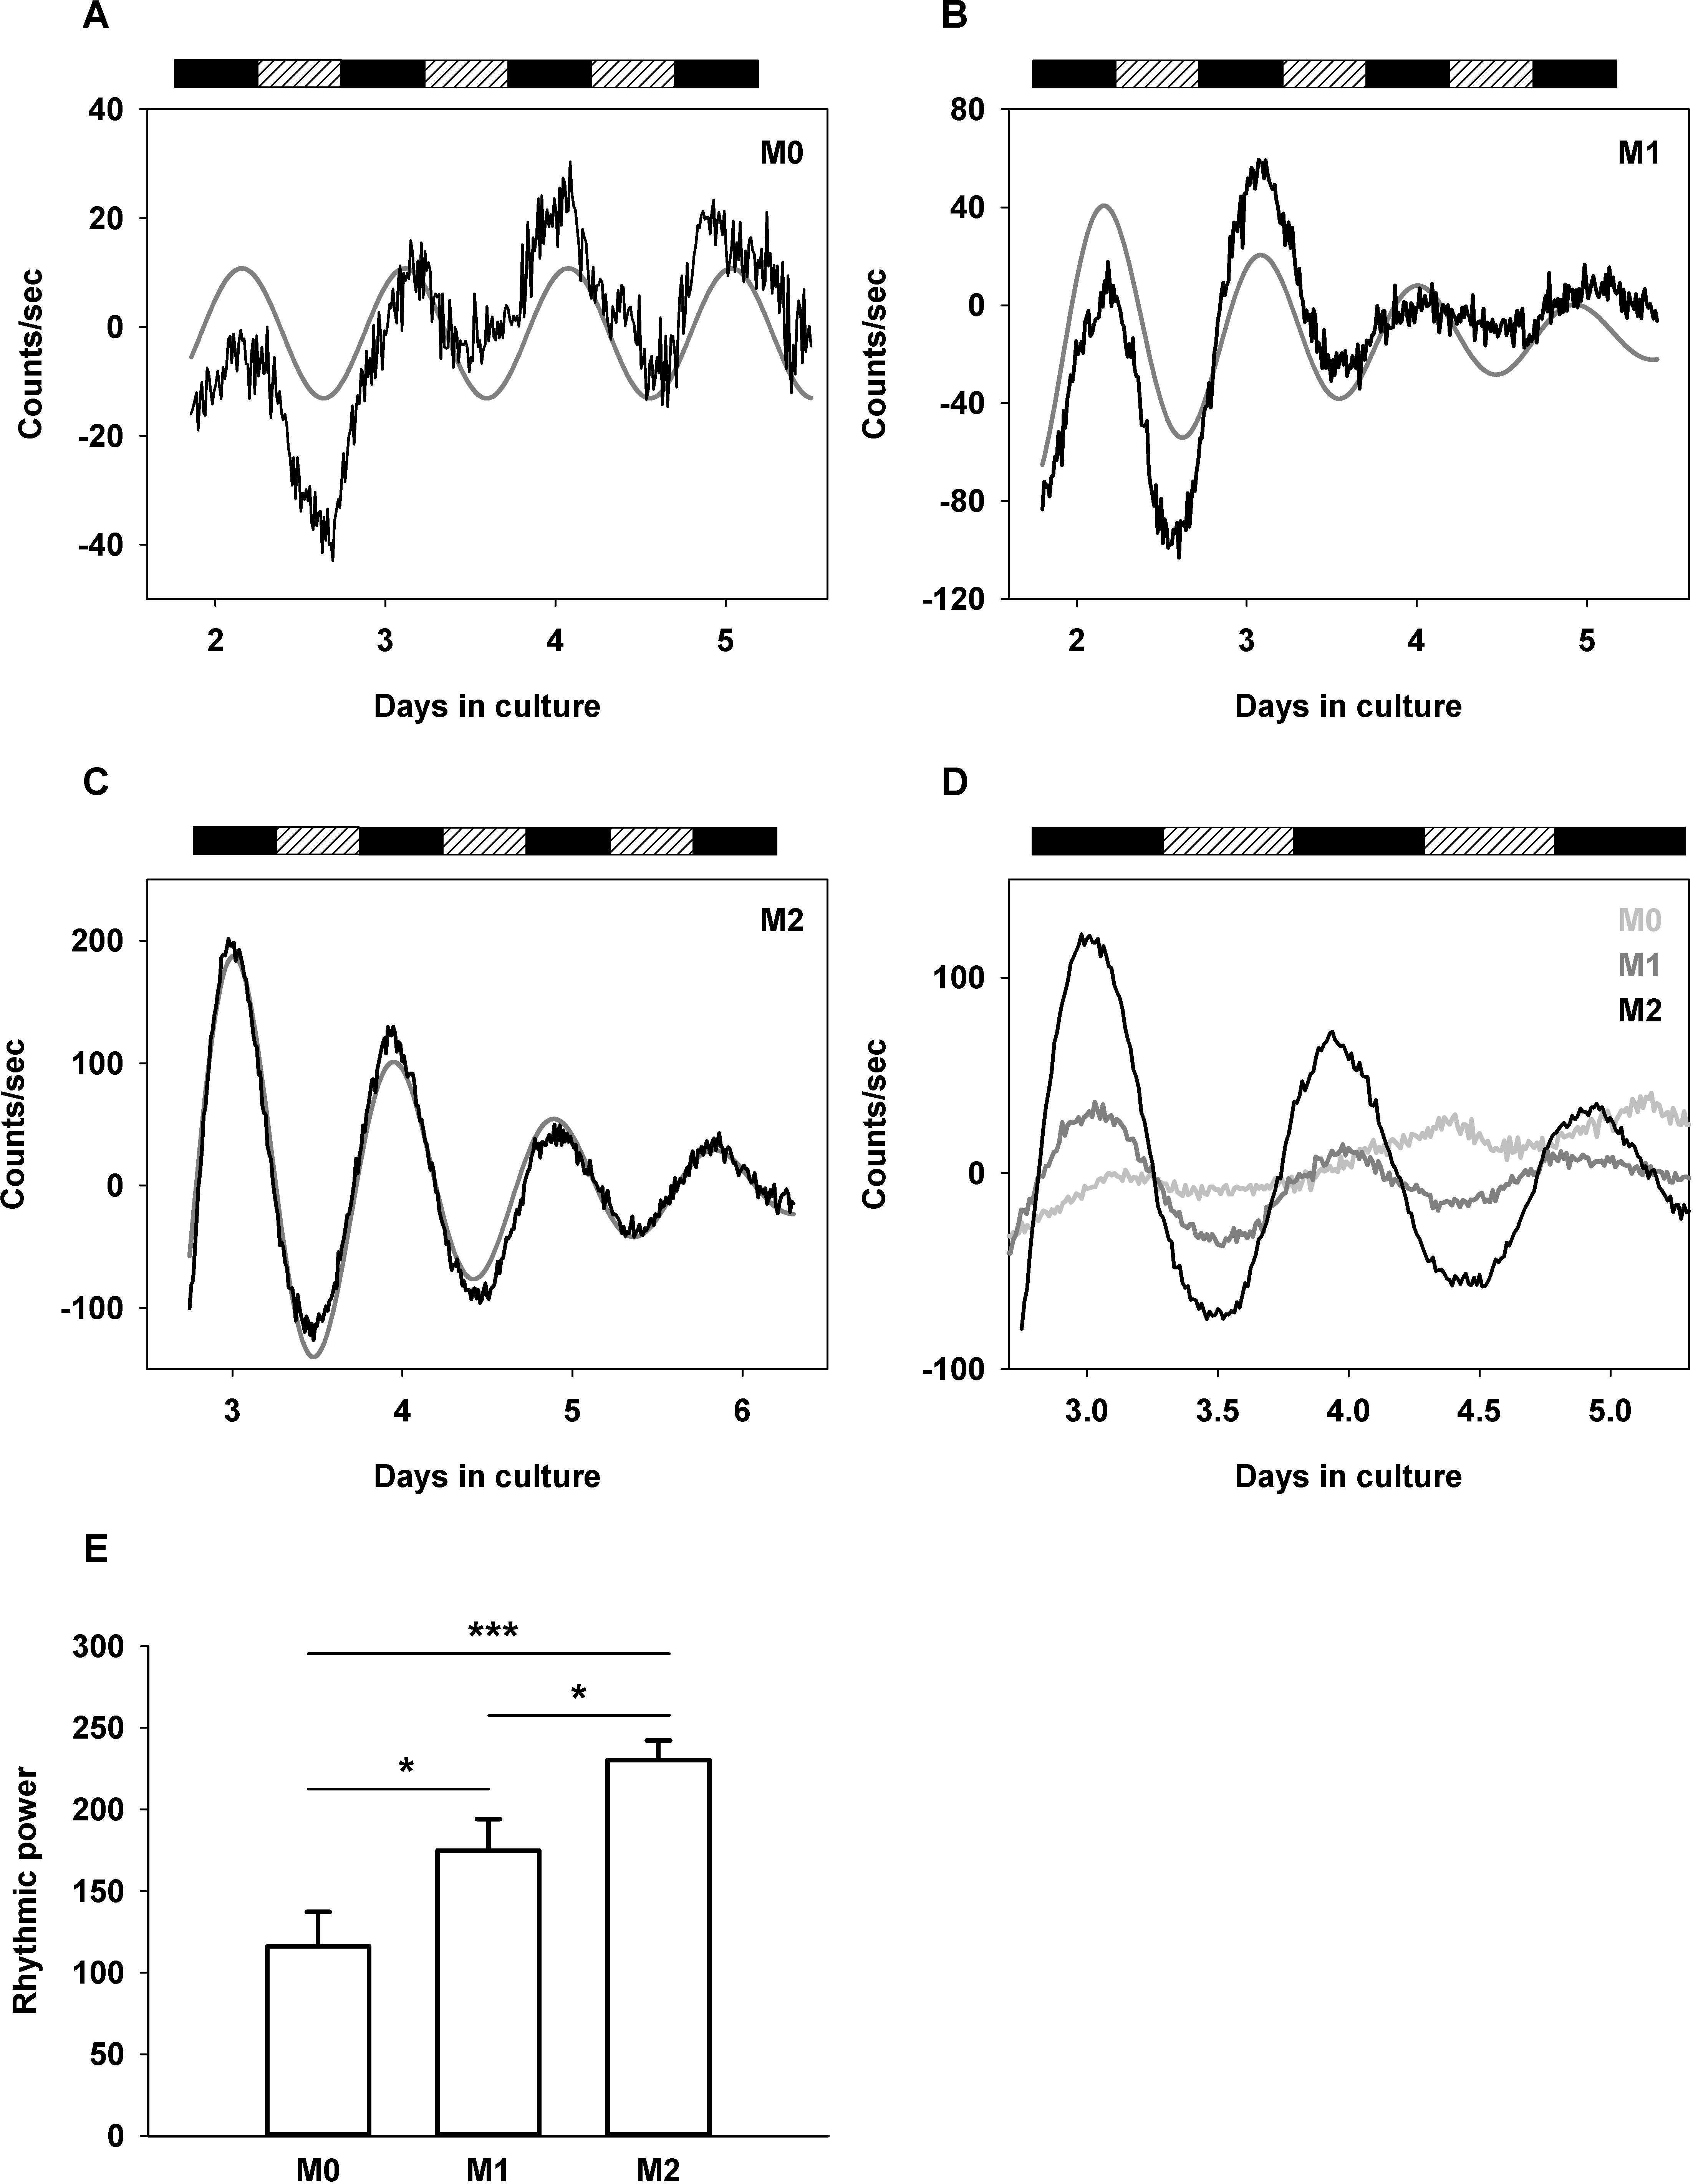
 Figure 4 of
Buonfiglio, Mol Vis 2014; 20:742-752.
Figure 4 of
Buonfiglio, Mol Vis 2014; 20:742-752.