Figure 3. Temporal profiles of clock-controlled gene transcripts in retina explants cultured for 48 h. Aanat (A) and c-fos (B) mRNA amounts (log units) are expressed relative to the 28 h time point (one experiment; n = 3 per time point). Mean values±standard
error of the mean (SEM) are shown together with the best fitted sine wave curve. Alternating rectangles at the top indicate
the projection of the lighting schedule (black: 12 h dark; hatched: 12 h light) to which animals were exposed before they
were euthanized.
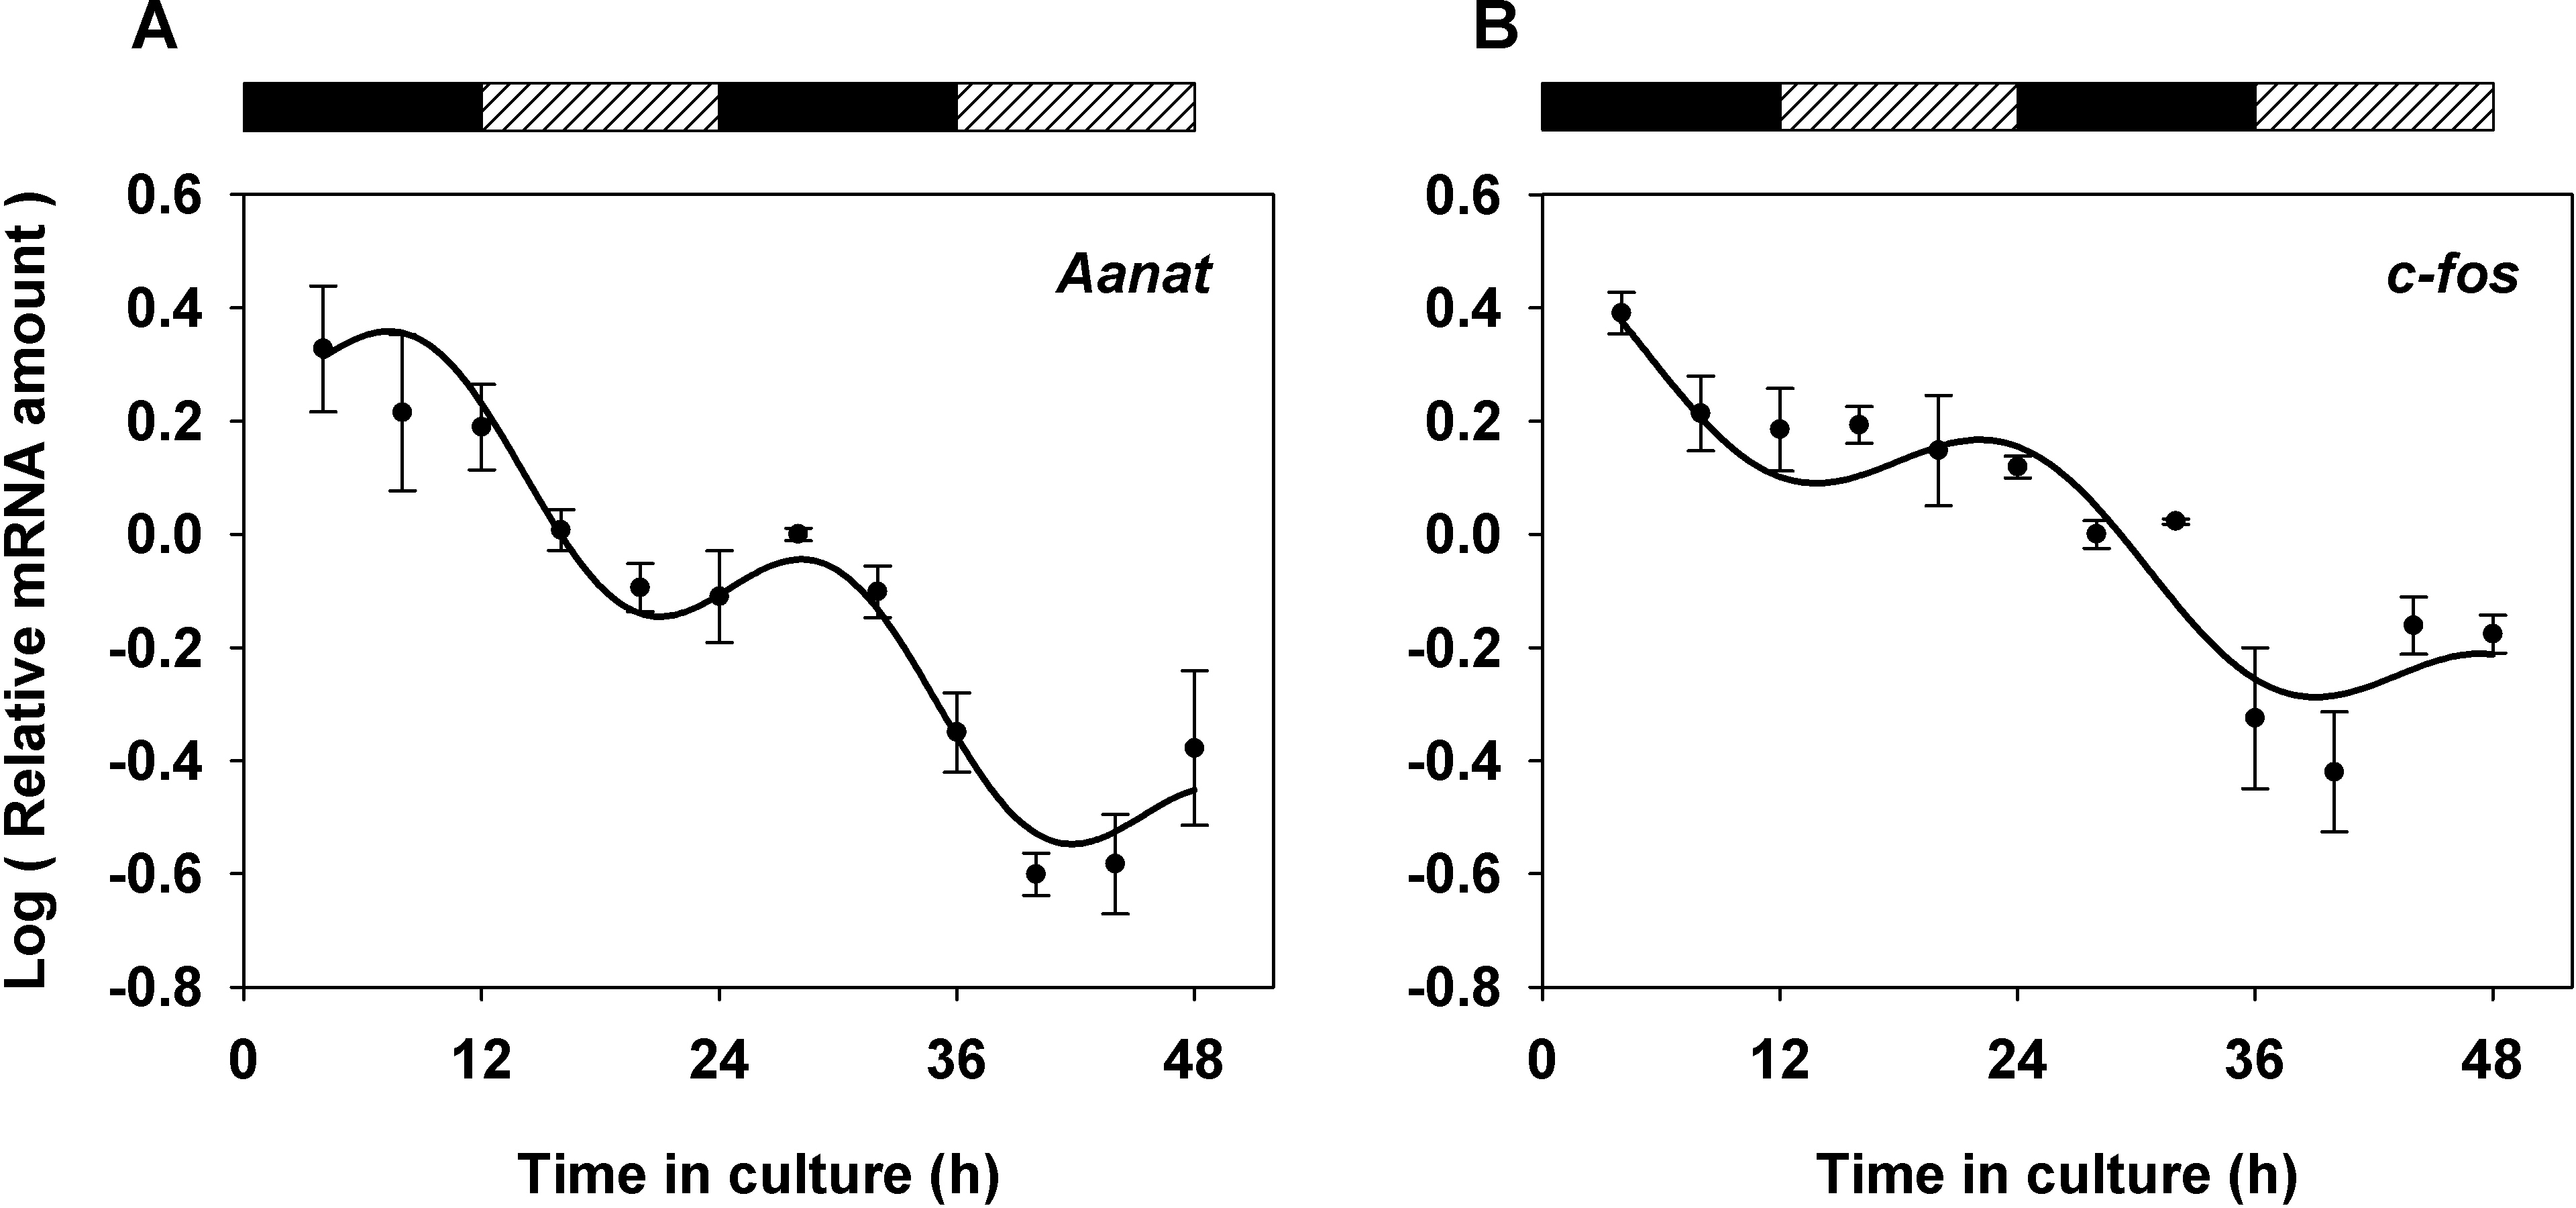
 Figure 3 of
Buonfiglio, Mol Vis 2014; 20:742-752.
Figure 3 of
Buonfiglio, Mol Vis 2014; 20:742-752.