Figure 6. Evolutionary conservation of p.Asp406Gly (D406G) mutation in different species. Amino acid residues highly conserved in all
species are indicated by asterisk, and lower identity are shown using colon. Red color box indicate NR2E3 mutations analyzed in this study.
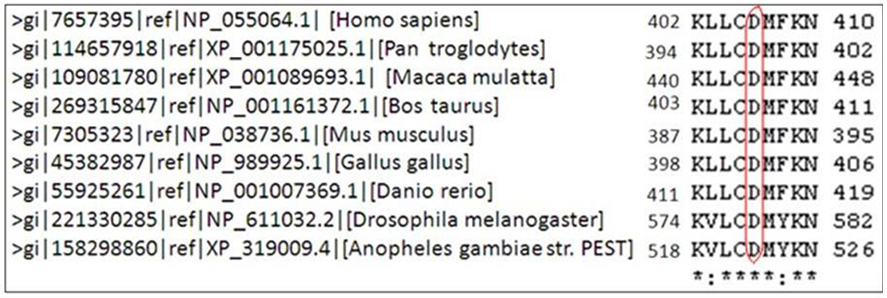
 Figure 6 of
Manayath, Mol Vis 2014; 20:724-731.
Figure 6 of
Manayath, Mol Vis 2014; 20:724-731.