Figure 5. Chromatogram representing the p.Asp406Gly mutation in the NR2E3 gene. A: p.Asp406Gly mutation in the homozygous state. B: p.Asp406Gly mutation in the heterozygous state. C: Wild type. The underline marks the mutated codon. The arrow indicates the position of the mutation.
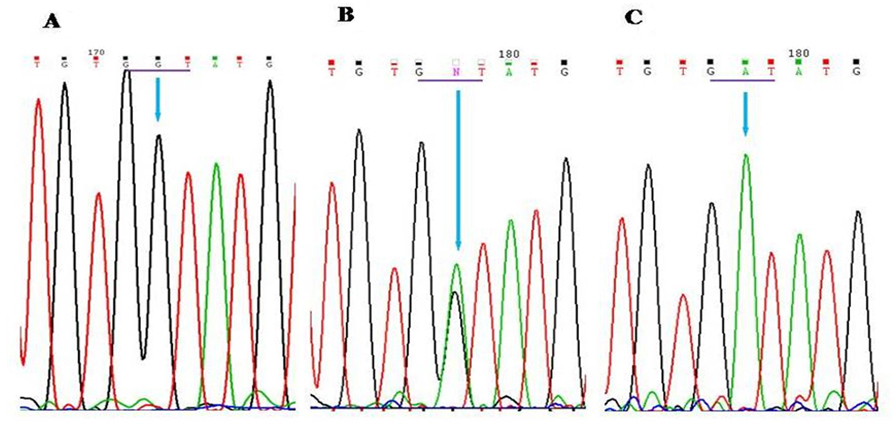
 Figure 5 of
Manayath, Mol Vis 2014; 20:724-731.
Figure 5 of
Manayath, Mol Vis 2014; 20:724-731.