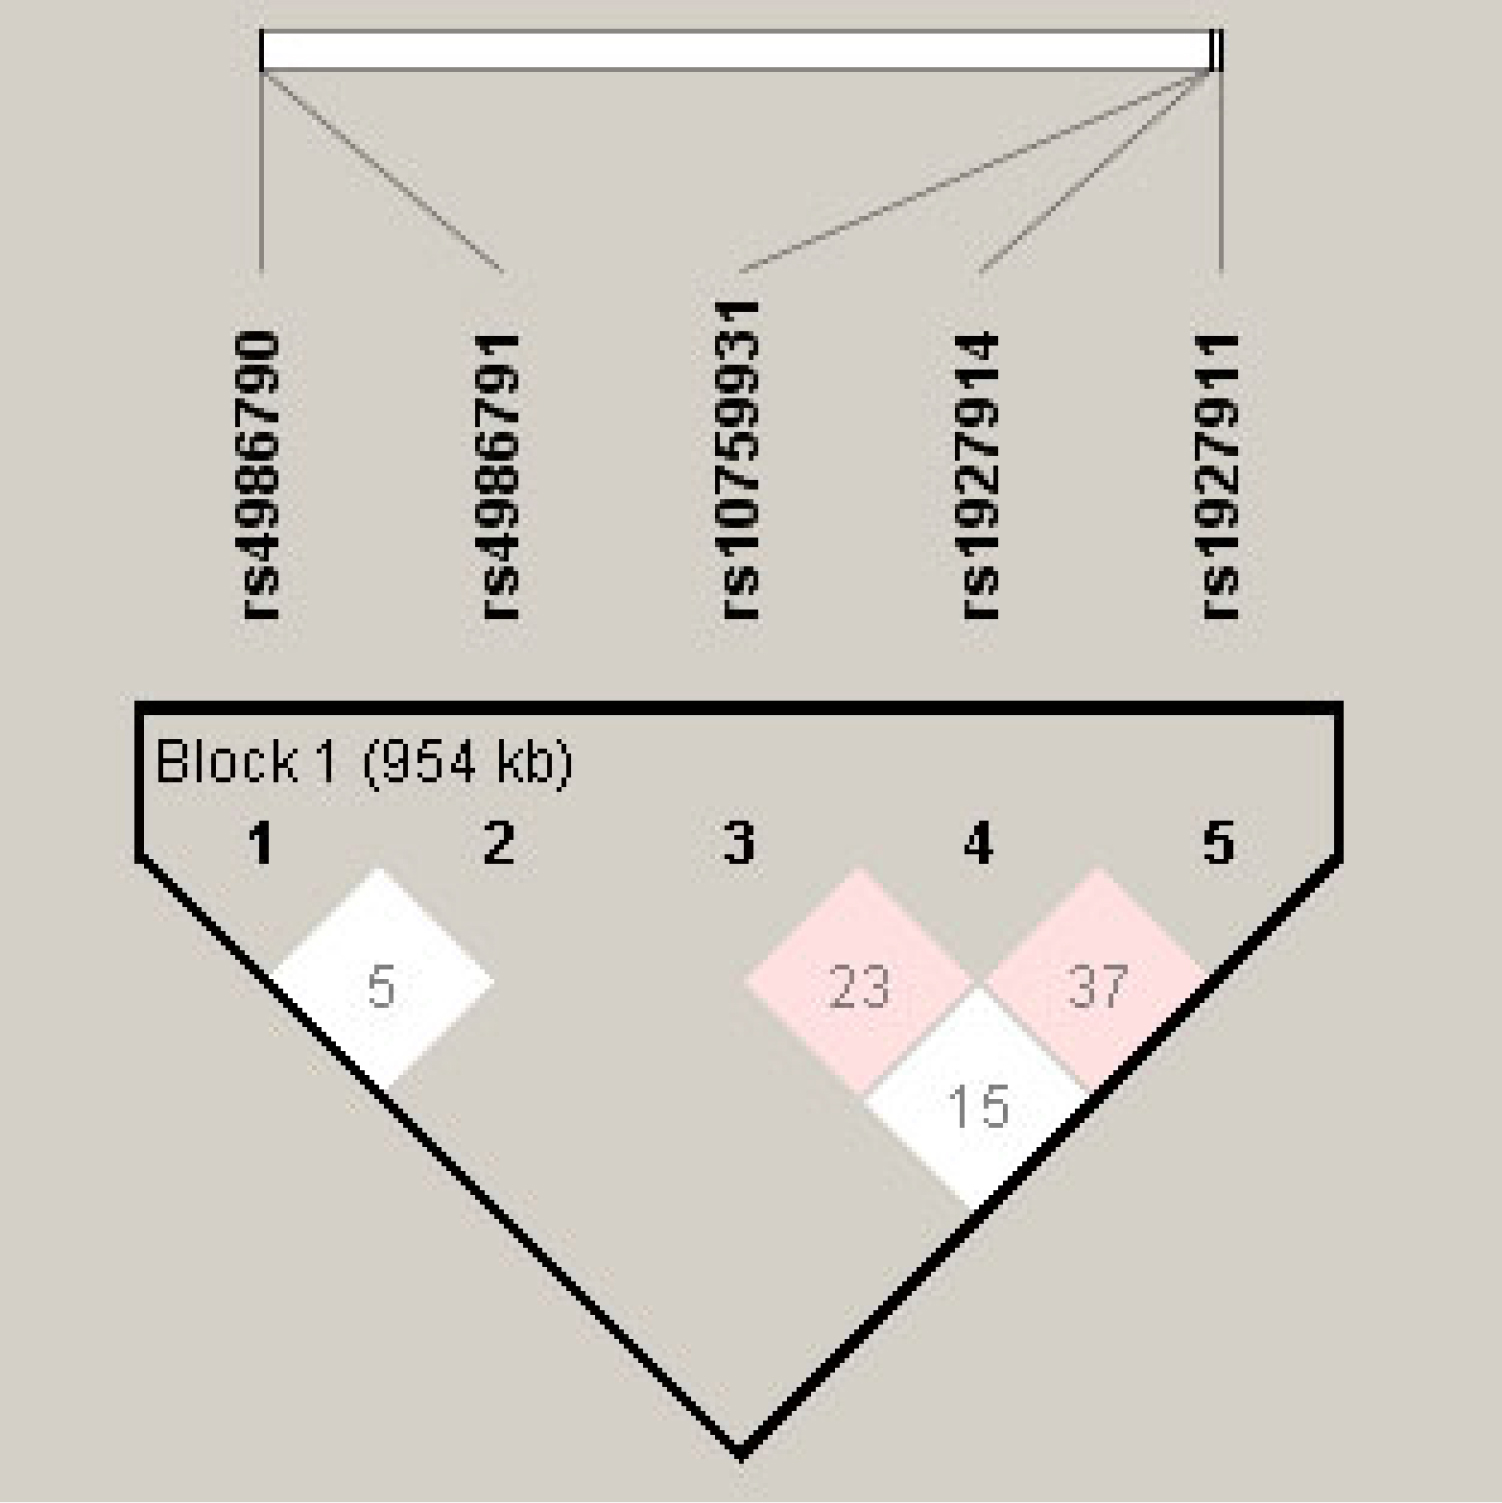
Figure 2. Linkage disequilibrium plot. Haplotype frequencies and LD were calculated using Haploview software (version 4.2). The LD parameter
D is represented by the specific value in each cell. The cells are color graduated representing the strength of LD between
the two markers. The rs numbers are SNP IDs extracted from the
Ensembl database. The loci
rs10759931,
rs1927911, and
rs1927914 are in intermediate LD.
 Figure 2 of
Singh, Mol Vis 2014; 20:704-713.
Figure 2 of
Singh, Mol Vis 2014; 20:704-713.