Figure 4. DNA sequence analysis of exon 11 and flanking sequences of the OPA1 gene in family F4. A: Pedigree F4. The arrow indicates the proband. Affected and unaffected individuals are represented with black and open circles,
respectively. Males are represented with a quadrant and females with a circle. The asterisk sign indicates individuals both
clinically and genetically examined. B: Mutant sequence in proband F4 III:1. C: Normal sequence. The arrows in B and C indicate the position of the G to C substitution at the fifth nucleotide of the 5′ donor site of intron 11.
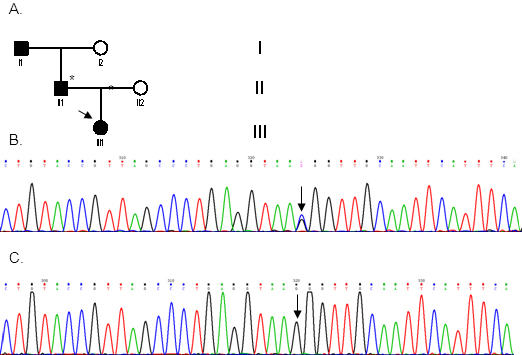
 Figure 4 of
Kamakari, Mol Vis 2014; 20:691-703.
Figure 4 of
Kamakari, Mol Vis 2014; 20:691-703.