Figure 3. DNA sequence analysis of exon 24 and flanking sequences of the OPA1 gene in family F3. A: Pedigree F3. The arrow indicates the proband. Affected and unaffected individuals are represented with black and open circles,
respectively. Males are represented with a quadrant and females with a circle. The asterisk sign indicates individuals both
clinically and genetically examined. Questions marks indicate probably affected family members. B: Mutant sequence in proband F3 III:24. The antisense sequence confirmed the same in-frame mutation. C: Normal sequence. The arrows in B and C indicate the deletion of nucleotide A (c.2366delA) resulting in the frameshift p.(Asn789Metfs*11) mutation of the OPA1 protein.
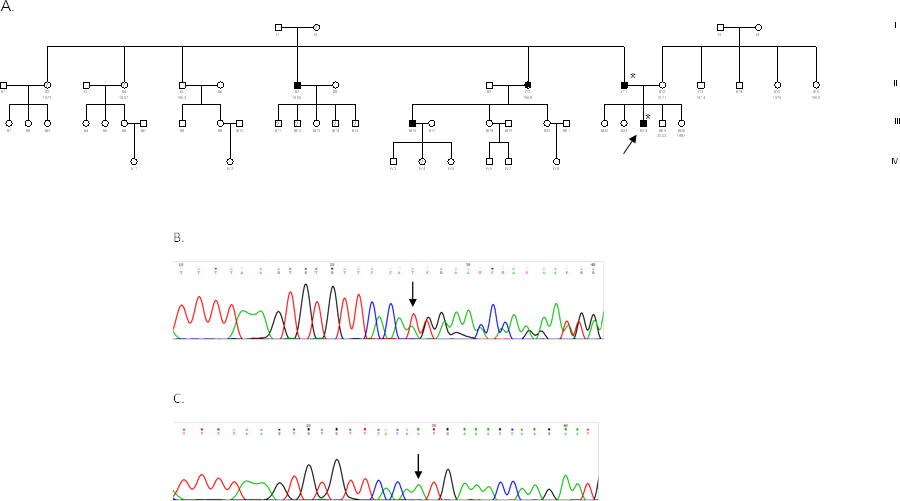
 Figure 3 of
Kamakari, Mol Vis 2014; 20:691-703.
Figure 3 of
Kamakari, Mol Vis 2014; 20:691-703.