Figure 1. DNA sequence analysis of exon 9 and flanking sequences of the OPA1 gene in family F1. A: Pedigree F1. The arrow indicates the proband. Affected and unaffected individuals are represented with black and open circles,
respectively. Males are represented with a quadrant and females with a circle. The asterisk sign indicates individuals clinically
and genetically examined. B: Mutant sequence in proband F1 II:5. The antisense sequence confirmed the same in-frame mutation. C: Normal sequence. The horizontal lines in B and C indicate deletion of the three nucleotides TGT (c.876_878delTGT) resulting in the in-frame deletion of valine at codon 294
of the OPA1 protein [p.(Valdel294)].
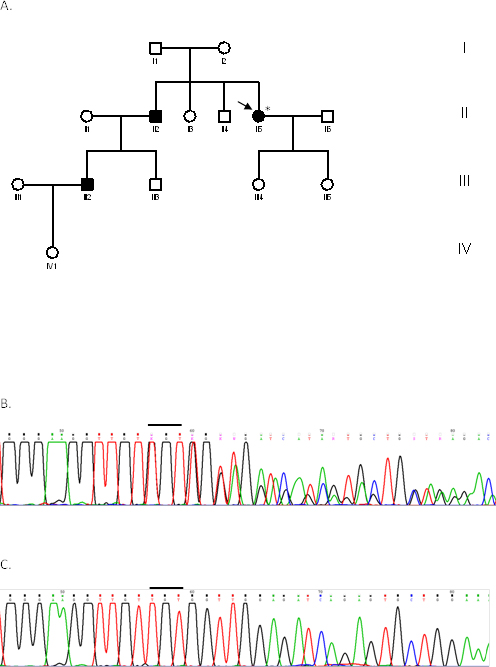
 Figure 1 of
Kamakari, Mol Vis 2014; 20:691-703.
Figure 1 of
Kamakari, Mol Vis 2014; 20:691-703.