Figure 6. MTT assay for effects of ranibizumab on uveal melanoma cells and ARPE-19 cells. A: The dynamic response of malignant melanoma cells with different concentrations of ranibizumab: untreated cells (control);
0.l mg/ml; 0.25mg/ml; 0.5mg/ml and 1mg/ml. B: The dynamic response of ARPE-19 with different concentrations of ranibizumab: untreated cells (control); 0.l mg/ml; 0.25
mg/ml; 0.5 mg/ml and 1 mg/ml. Date represents four independent experiment and all data points plotted as mean values±SD (*p<0.05).
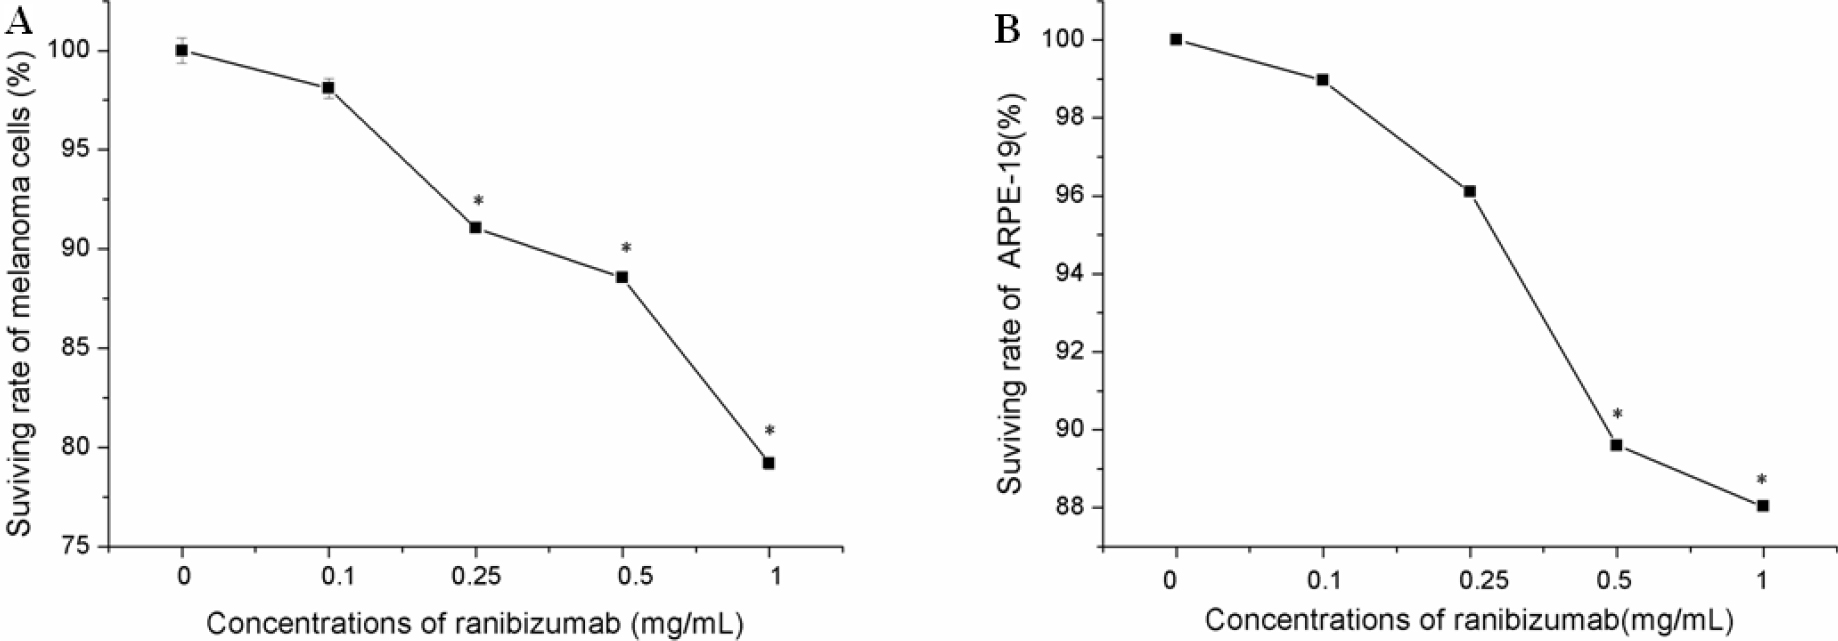
 Figure 6 of
Li, Mol Vis 2014; 20:649-660.
Figure 6 of
Li, Mol Vis 2014; 20:649-660.