Figure 5. Dynamic response of malignant melanoma and ARPE-19 cell exposure to ranibizumab. A and B represent the dynamic response of malignant melanoma cells with different concentrations of ranibizumab, as follows: untreated
cells (control); 0.1 mg/ml; 0.25 mg/ml; 0.5 mg/ml; and 1 mg/ml. B: Comparison of decreases in cell activity in the presence of ranibizumab after malignant melanoma cells were incubated in
the cell system for about 72 h. *p<0.05 compared to untreated cells. C and D show the dynamic response of ARPE-19 with different concentrations of ranibizumab, as follows: untreated cells (control);
0.1 mg/ml; 0.25 mg/ml; 0.5 mg/ml; and 1 mg/ml. D: Comparison of decreases in cell activity in the presence of ranibizumab after ARPE-19 cells were incubated in the cell system
for about 72 h. *p<0.05 compared to untreated cells. Data represents three independent experiment and all data points plotted
as mean values±SD (*p<0.05).
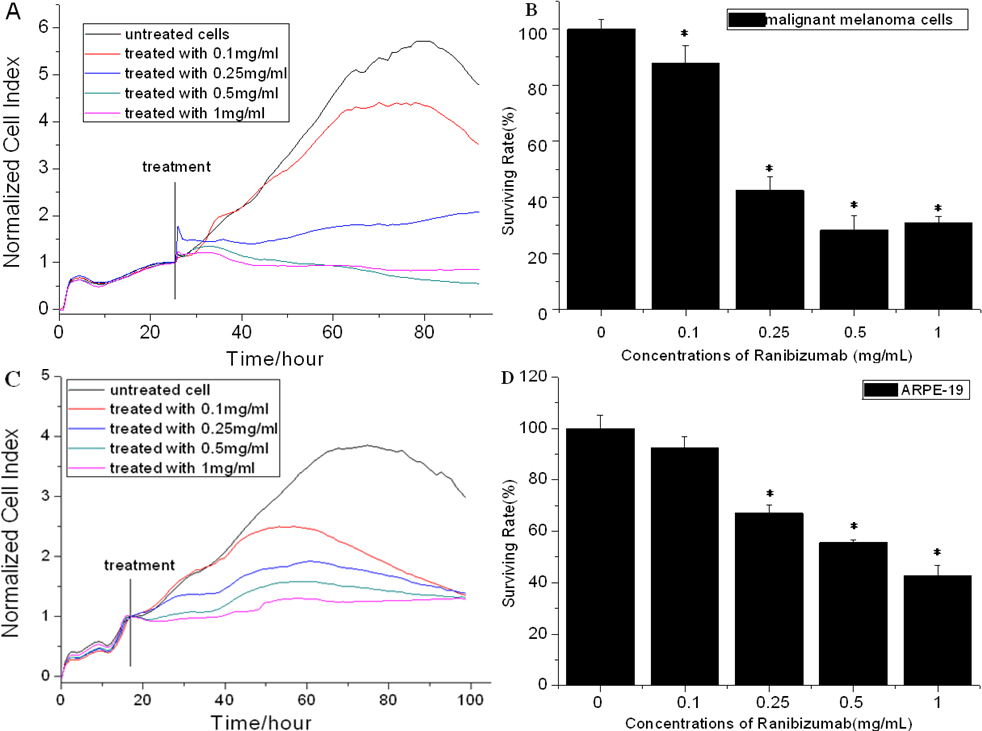
 Figure 5 of
Li, Mol Vis 2014; 20:649-660.
Figure 5 of
Li, Mol Vis 2014; 20:649-660.