Figure 2. Triamcinolone acetonide concentration time profiles in the vitreous of rabbits following intravitreal injection of triamcinolone
acetonide. The concentrations of intravitreal 4 mg (A) and 8 mg (B) triamcinolone acetonide (TA) decreased gradually with time. Values represent mean±SD (n = 6).
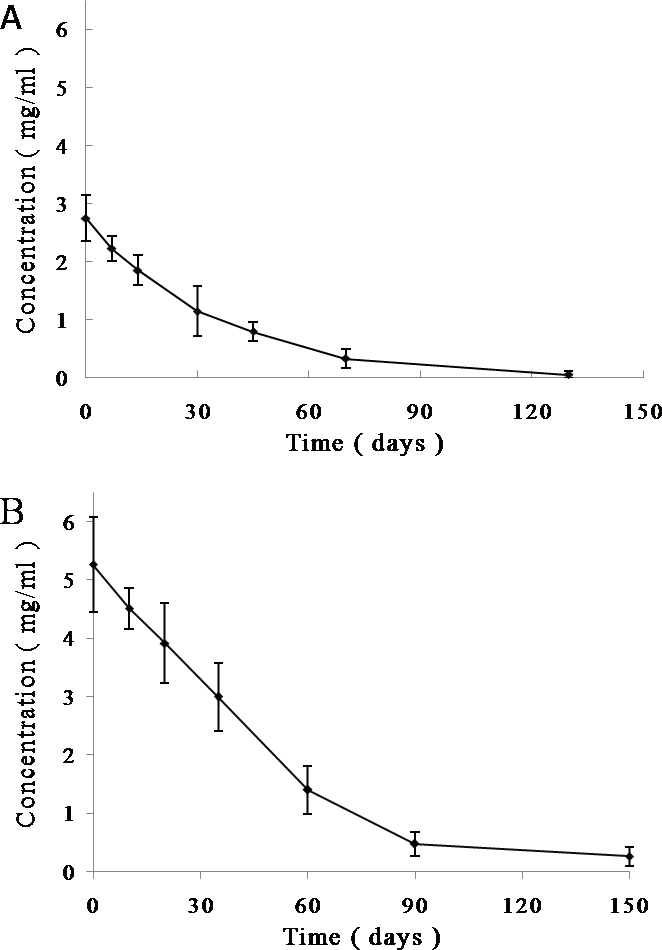
 Figure 2 of
Ye, Mol Vis 2014; 20:629-636.
Figure 2 of
Ye, Mol Vis 2014; 20:629-636.