Figure 6. Tumor necrosis factor-α (TNF-α) was released from the activated microglia induced by retinal neuronal monocyte chemoattractant
protein-1 (MCP-1) via the nuclear factor-κB pathways. A: Real-time PCR was used to measure TNF-α mRNA expression. Dose-dependent inhibition of the expression of TNF-α mRNA was induced
by retinal neuronal MCP-1 in the retinal neuron–microglia Transwell culture system by nuclear factor-κB (NF-κB) inhibitors.
B: Enzyme-linked immunosorbent assay (ELISA) was used to measure the soluble TNF-α concentration. Dose-dependent inhibition
of the expression of soluble TNF-α was induced by NF-κB inhibitors. C: Western blot analysis of NF-κB p50 and p65 subunits in nuclear fractions of microglial cells treated with advanced glycation
end products (AGEs; 750 μg/ml) in the presence or absence of anti-MCP-1. The levels of the p50 and p65 subunits of NF-κB from
the microglial nuclear fractions increased by retinal neuronal MCP-1; however, anti-MCP-1 led to downregulation (**p<0.01).
D: Purified microglia were stained with fluorescein isothiocyanate (FITC)-CD11b (green), and the expression of TNF-α was labeled
with PE (red). The number of CD11b and TNF-α double-stained cells (activated microglia) decreased markedly after AGE treatment
with NF-κB inhibitors (control: 11.33±3.56 cells/microscopic visual field; AGE: 26.36±4.52 cells/microscopic visual field;
NF-κB inhibitors: 17.89±2.87 cells/microscopic visual field; p=0.015).
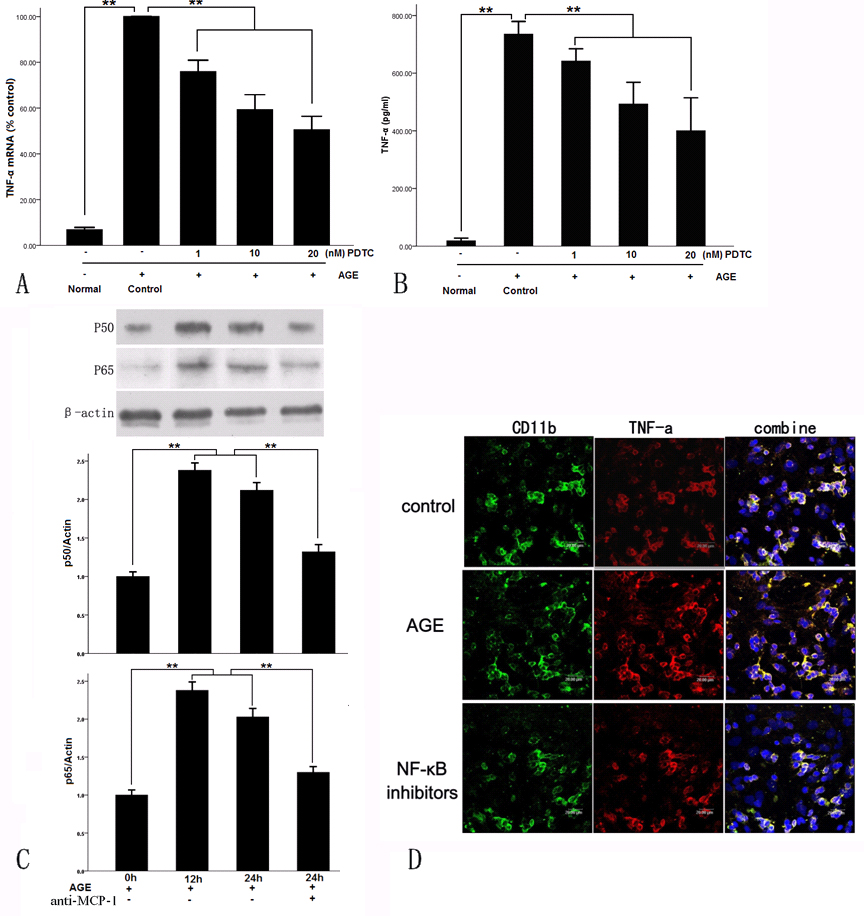
 Figure 6 of
Dong, Mol Vis 2014; 20:616-628.
Figure 6 of
Dong, Mol Vis 2014; 20:616-628.