Figure 4. Analysis of cell migration after gene silencing (n = 4), using a modified Boyden chamber. Cell migration is shown with arrows.
A: Migration of normal corneal fibroblast. B: Migration of cells after treatment with scrambled siRNA. C: Migration of cells after treatment of corneal fibroblast with GAPDH siRNA. D: Migration of cells after treatment of normal corneal fibroblast with human antigen R (HuR) siRNA. E: Migration of cells after treatment of normal corneal fibroblast with β-actin siRNA. F: Bar graph showing cell migration after different treatments (A to E). Cells were counted from six different frames. All the treatments were performed in tetraplicate, and standard deviations
were calculated.
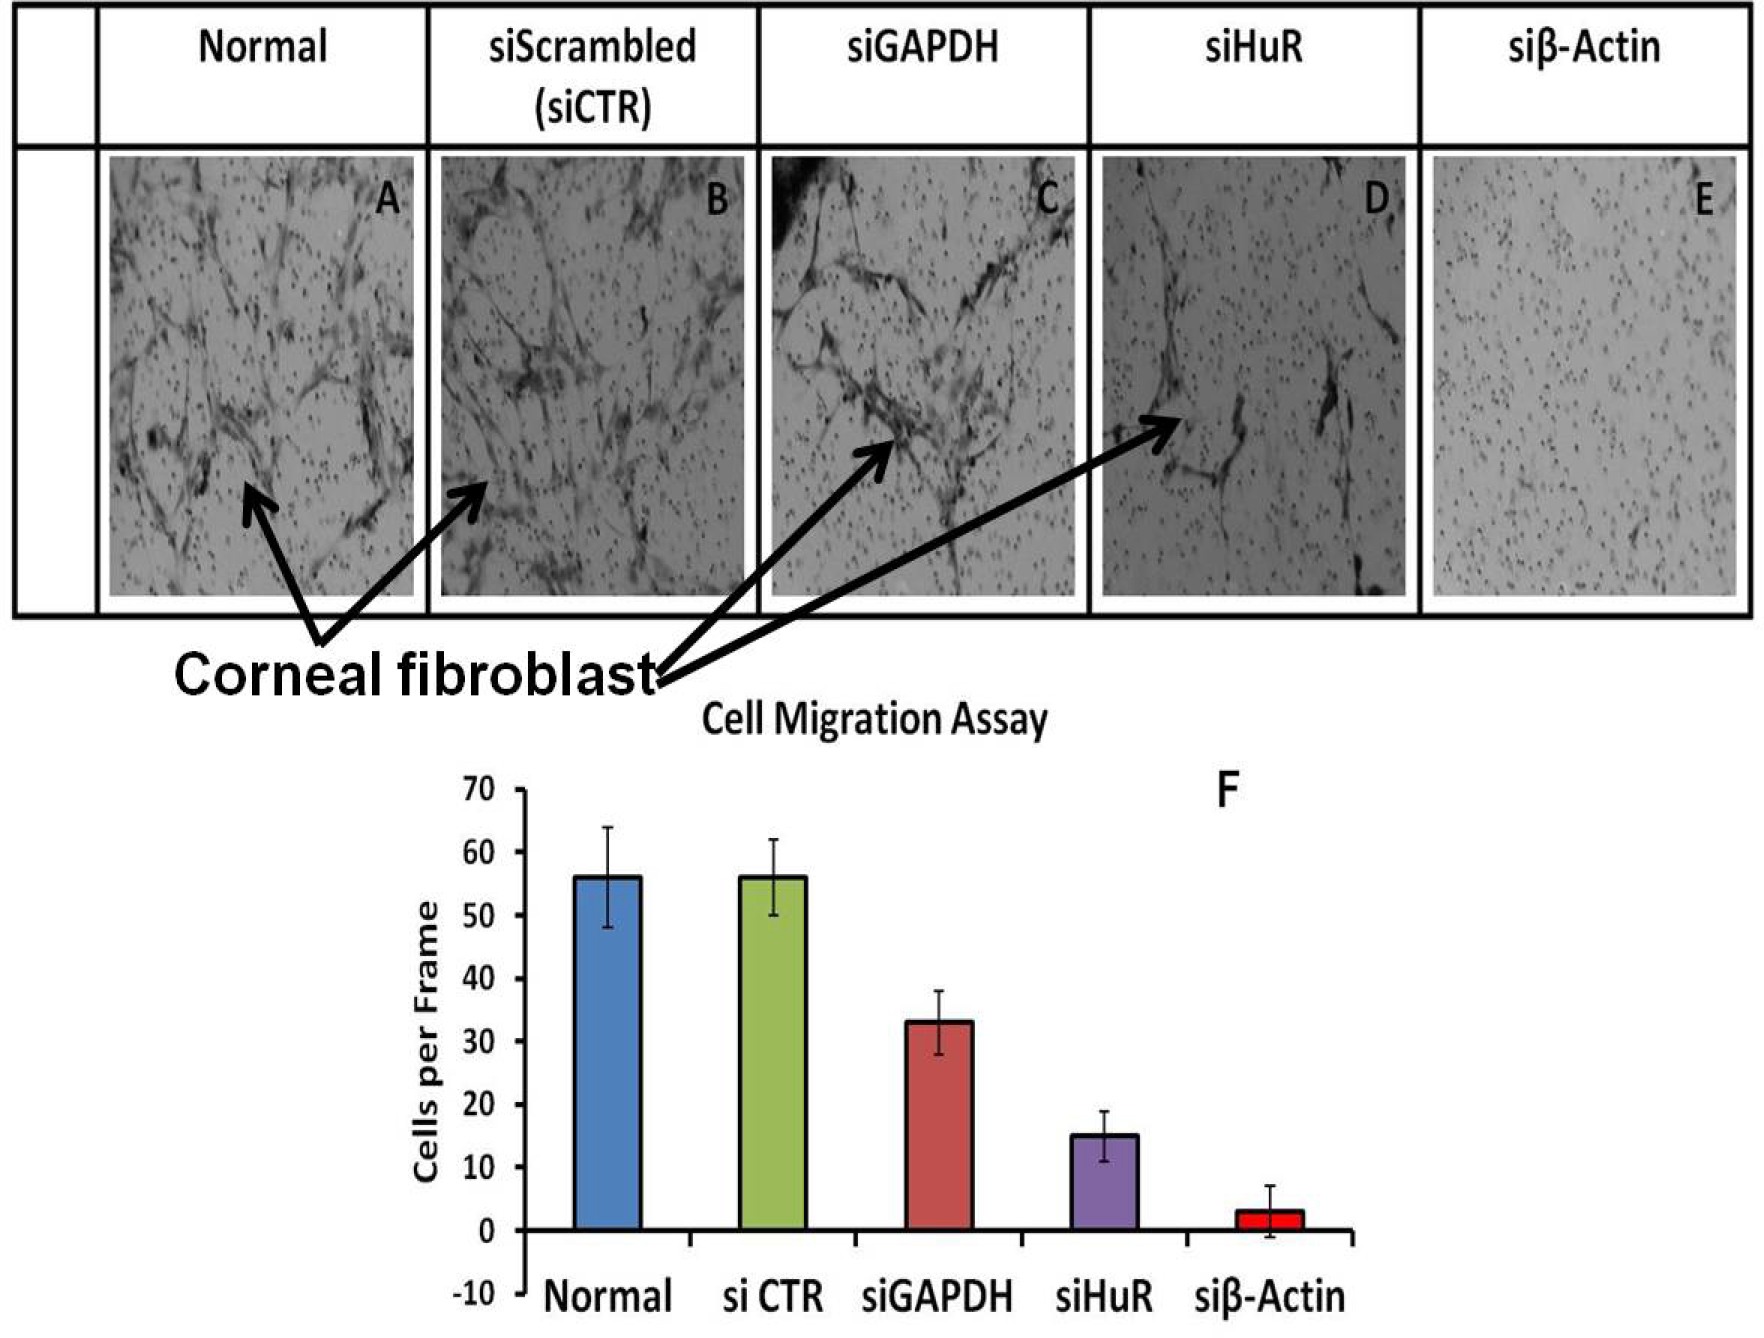
 Figure 4 of
Joseph, Mol Vis 2014; 20:593-605.
Figure 4 of
Joseph, Mol Vis 2014; 20:593-605.