Figure 1. Gene expression analysis after gene silencing. A: Detection of the expression of glyceraldehyde 3-phosphate dehydrogenase (GAPDH), β-actin, and human antigen R (HuR) genes after gene silencing using RT–PCR. In the analyses, cells were examined 24 h after the treatments. In (A), (I): RT–PCR analysis of β-actin gene expression in corneal fibroblasts after gene silencing using siScrambled, siGAPDH,
siβ-actin, or small interfering human antigen R (siHuR). (II): RT–PCR analysis of HuR gene expression in corneal fibroblasts after gene silencing using siScrambled, siGAPDH, siβ-actin, or siHuR. B: Western blot analysis of β-actin expression using the anti-β-actin antibody in corneal fibroblasts after gene silencing
using siScrambled, siGAPDH, siβ-actin or siHuR. Vimentin expression was used as a control. β-Actin expression was downregulated
on either β-actin gene silencing or that of HuR gene. C: A bar graph shows the percent of β-actin levels after the gene silencing. D: Real-time PCR analysis of the β-actin gene after the following treatments: siScrambled (siCTR), siGAPDH, siβ-actin, and siHuR.
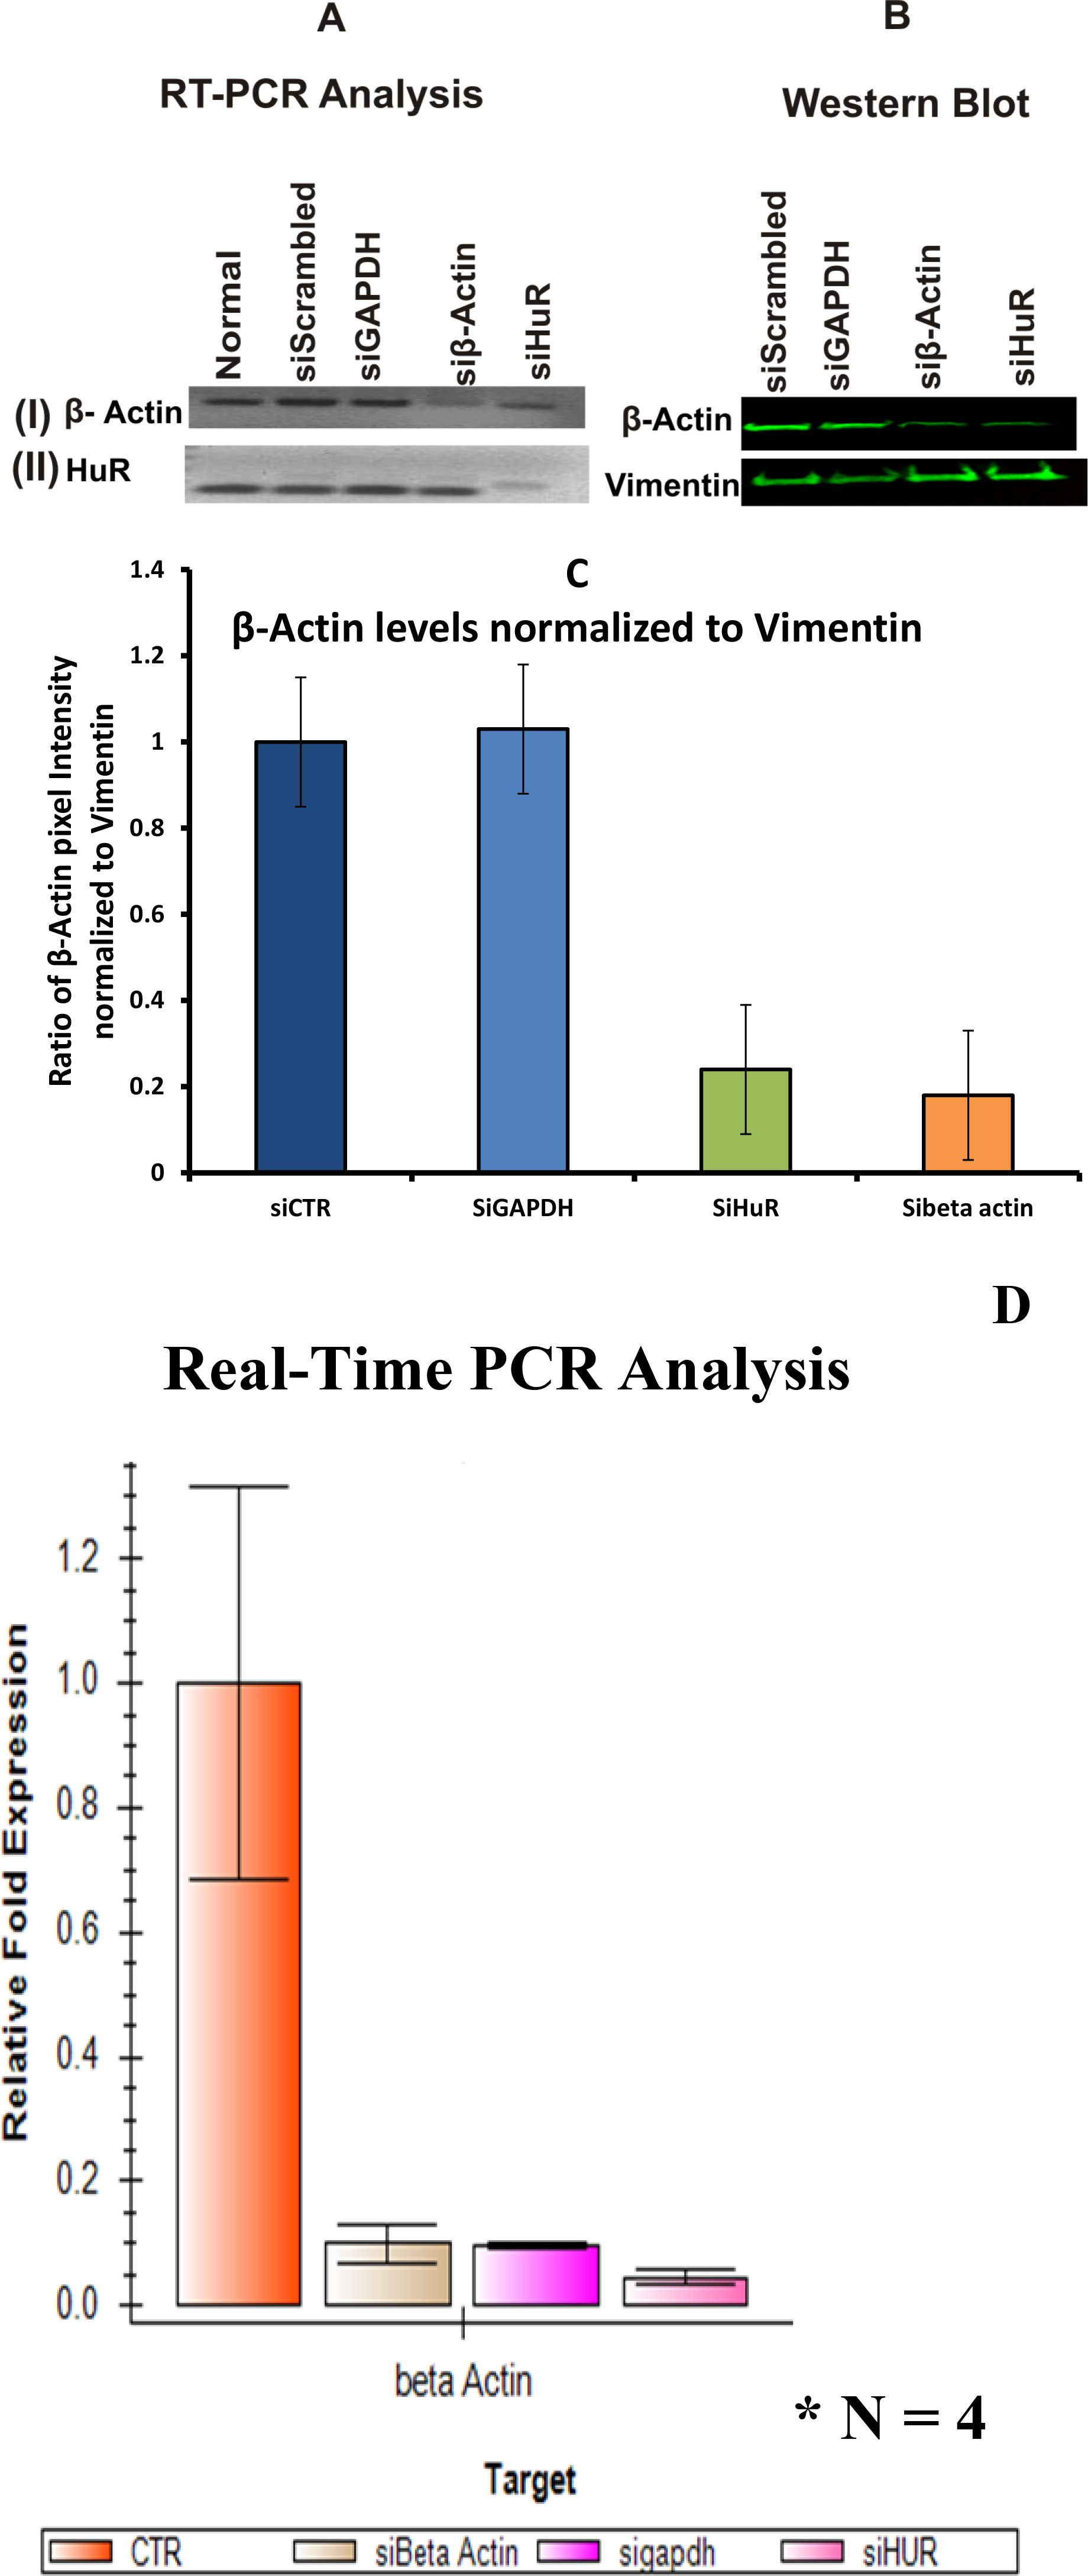
 Figure 1 of
Joseph, Mol Vis 2014; 20:593-605.
Figure 1 of
Joseph, Mol Vis 2014; 20:593-605.