Figure 8. Patient #5.Blue fundus autofluorescence (FAF) and spectral-domain optical coherence tomography (SD-OCT) reveal the right eye
affected with atrophic lesion at both study entry and last follow-up visit (38 months later). At study entry (top left and
bottom left panels), blue FAF frames show reduced autofluorescence (with some residual dispersed autofluorescent material),
and SD-OCT shows atrophic changes (diffuse loss of photoreceptor and other sensory retina layers, with retinal pseudocysts
[asterisk] and outer retinal tabulation [arrowhead]) within the area previously occupied by the yellowish material. Blue FAF
and SD-OCT findings appear unchanged at the last follow-up visit (top right and bottom right panels). Note the presence of
a hyperautofluorescent ring.
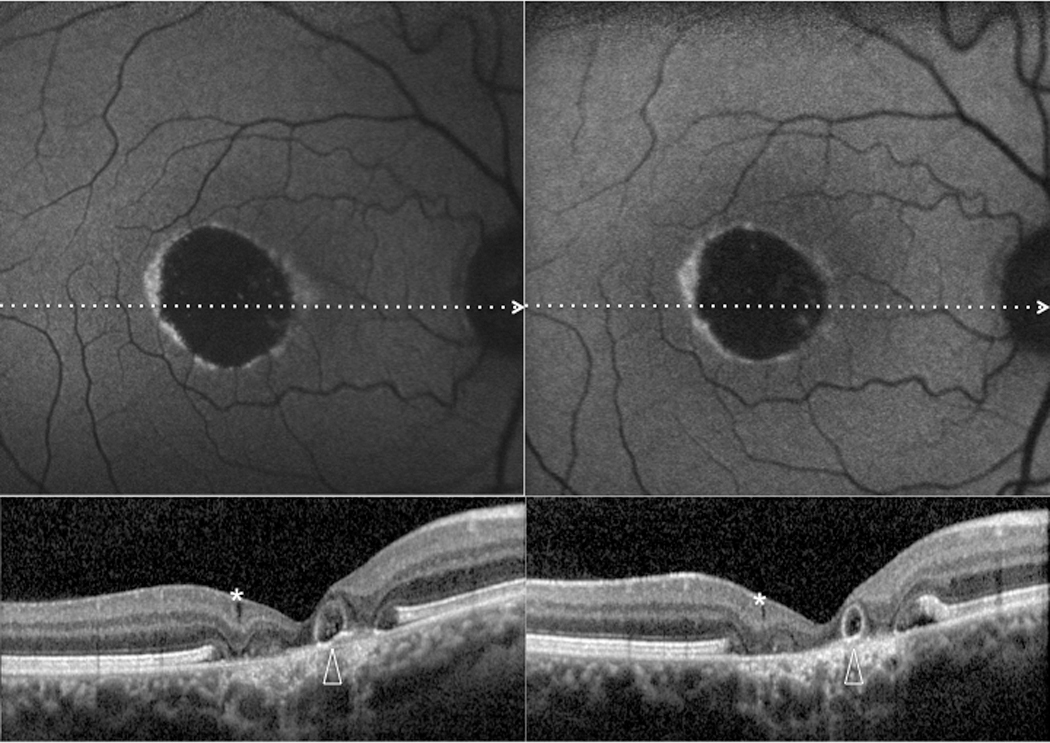
 Figure 8 of
Querques, Mol Vis 2014; 20:575-592.
Figure 8 of
Querques, Mol Vis 2014; 20:575-592.