Figure 2. Patient #9. Blue fundus autofluorescence (FAF) and spectral-domain optical coherence tomography (SD-OCT) reveal the left eye
affected with previtelliform lesion at both study entry and last follow-up visit (50 months later). Blue FAF frames show no
increased macular autofluorescence at either study entry (top left panel) or the last follow-up visit (bottom left panel).
SD-OCT scans show a slight thickening of the hyperreflective band located between the hyperreflective photoreceptor inner
segment (IS) ellipsoid portion (ellipsoid zone, EZ) and the hyperreflective retinal pigment epithelium (RPE)/Bruch’s membrane
complex at study entry (top right panel) and the last follow-up visit (bottom right panel).
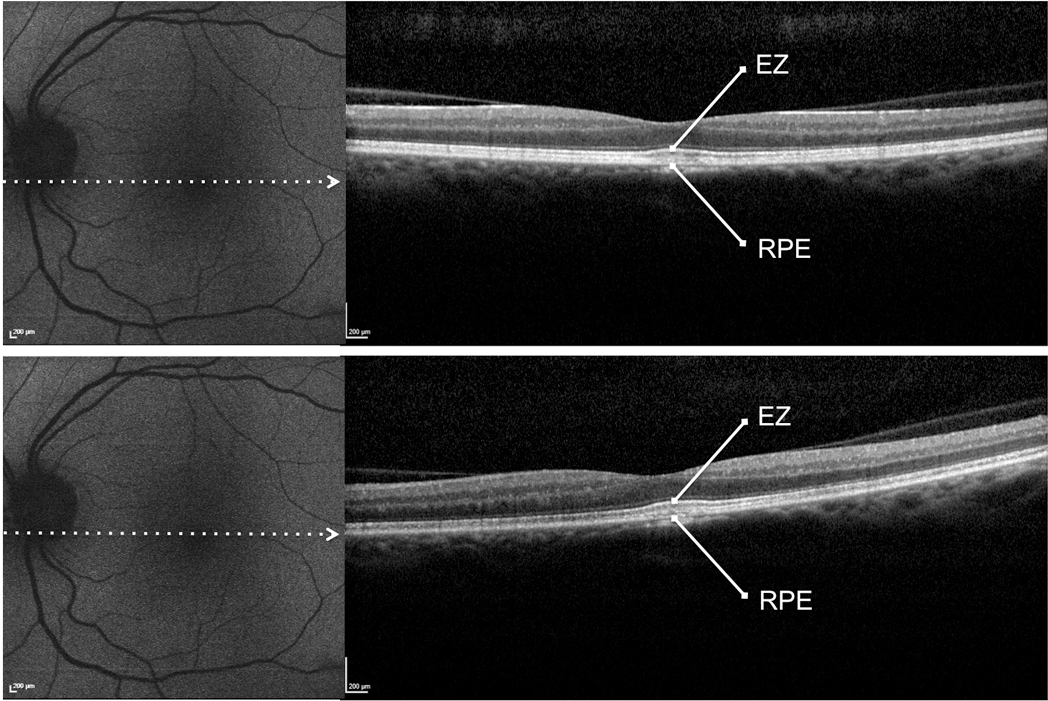
 Figure 2 of
Querques, Mol Vis 2014; 20:575-592.
Figure 2 of
Querques, Mol Vis 2014; 20:575-592.