Figure 1. Blue fundus autofluorescence (FAF) and spectral-domain optical coherence tomography (SD-OCT) of a pseudohypopyon lesion. Illustration
of the per protocol evaluation of the hyperautofluorescent (area encircled by a continuous line) and hypoautofluorescent (area
encircled by a dotted line) components of the lesion were measured using the measured using the Heidelberg software (top left
panel). The overall lesion area is the sum of the hyperautofluorescent and hypoautofluorescent areas. The SD-OCT scan shows
the hyper-reflective dome-shaped material located in the subretinal space, between the hyper-reflective photoreceptor inner
segment (IS) ellipsoid portion (ellipsoid zone, EZ) and the hyperreflective retinal pigment epithelium (RPE)/Bruch’s membrane
complex, matching with the hyperautofluorescent component of the lesion located inferiorly. The SD-OCT scan through the fovea
(asterisk) shows the partial reabsorption of the hyperreflective material and replacement by a hyporeflective fluid component
(bottom panel). The thickness of the neurosensory retina at the fovea and maximal thickness and width of the lesion was measured
using the caliper provided with the Heidelberg software (bottom panel).
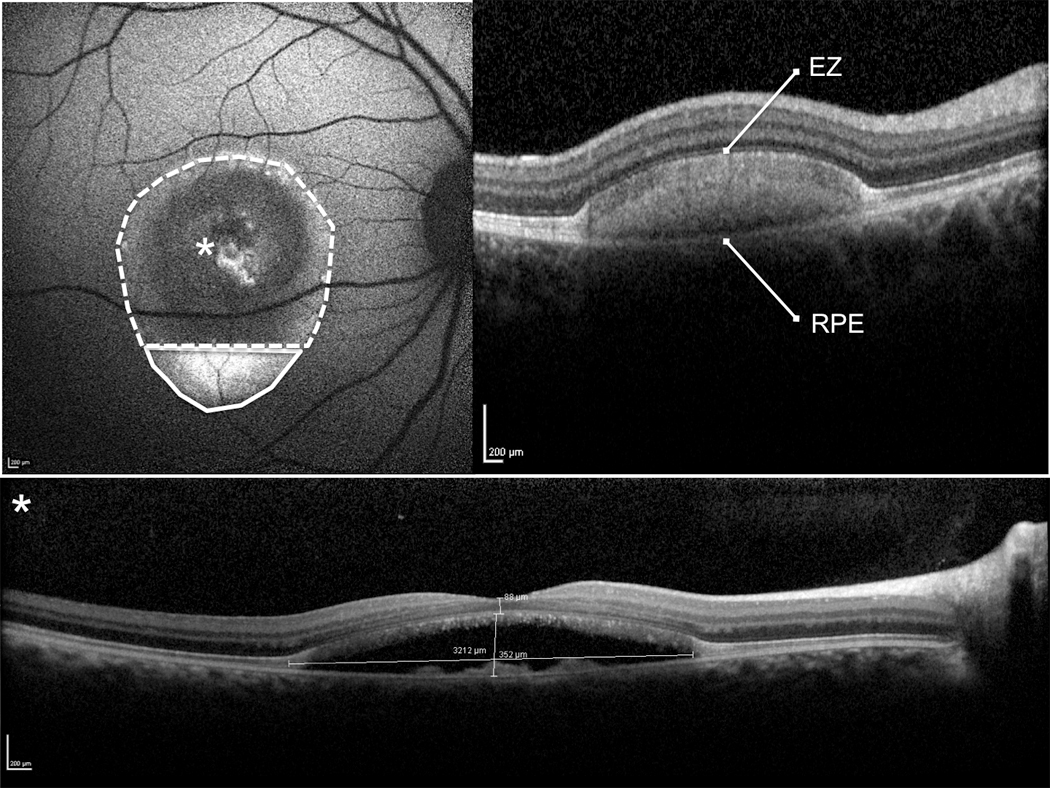
 Figure 1 of
Querques, Mol Vis 2014; 20:575-592.
Figure 1 of
Querques, Mol Vis 2014; 20:575-592.