Figure 3. Ultrastructural analysis of smarca4 RPE with transmission electron microscopy at 52 hpf indicates defects in melanogenesis. A: An example retinal pigment epithelium (RPE) cell of wild-type (WT) and smarca4 is shown. The red arrow indicates the basal side of the RPE cell. Scale bar=5 μm. Three whole-eye transverse sections were collected
for each genotype and several morphometric measurements of the melanosomes conducted. The results are shown in B–E. B: A strip chart of the number of melanosome per RPE cell area is shown. C: A strip chart of the apical/basal melanosome ratio in the RPE is shown. D: A boxplot of the melanosome roundness (1: round; 0: elongated). E: A boxplot of the melanosome area. The box plot is a graphical representation based on the distribution of the data. The
box shows the interquartile range (IQR) and the thick line inside the box shows the median. The dotted lines show the largest
or smallest values that fall within 1.5 times the IQR from the closest edge of the box. Values that are outside this range
are considered outliers and were plotted as individual circles. In all these plots, the data obtained from the RPE dorsal
and ventral to the optic nerve are plotted separately. The corresponding statistical analyses are shown in Appendix 1–Appendix
4, respectively.
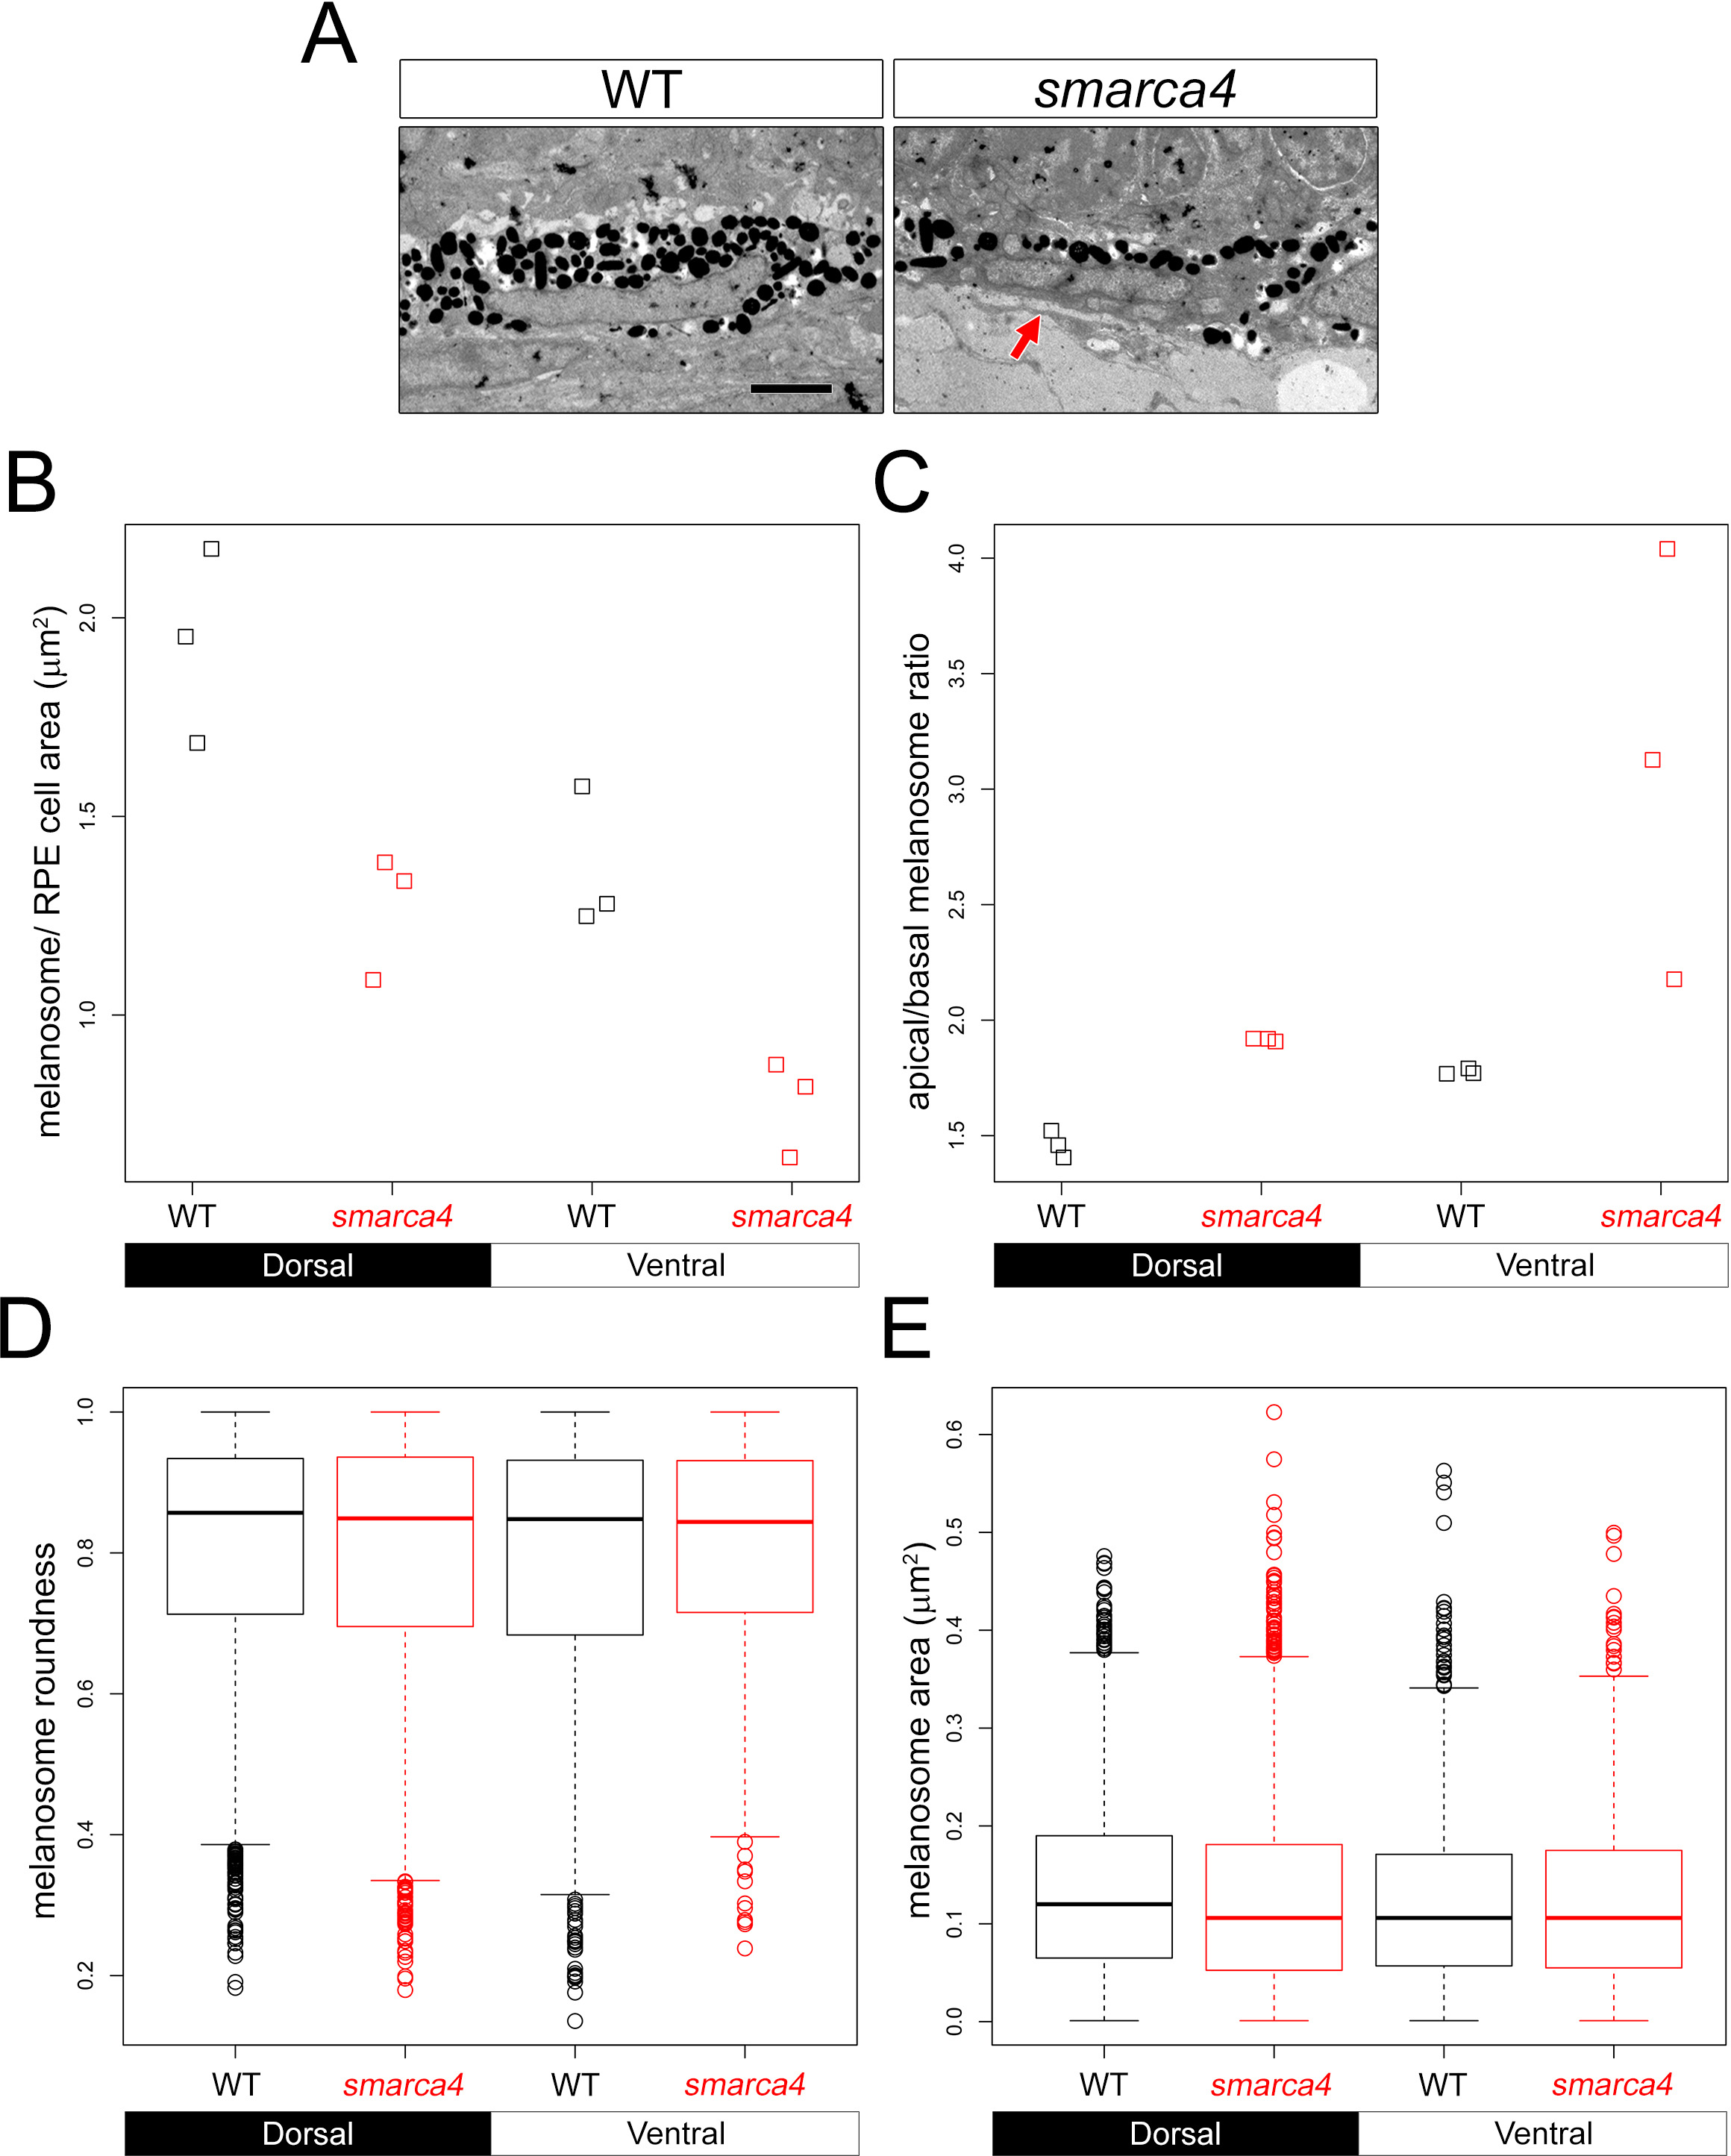
 Figure 3 of
Zhang, Mol Vis 2014; 20:56-72.
Figure 3 of
Zhang, Mol Vis 2014; 20:56-72.