Figure 1. Schematic representation of RB1 exonic mutation found in this study. Arabic numbers in the parentheses show the occurrence times for each mutation. All gray
bars represent null mutations, and the bars represent in-frame mutations. The dark gray regions on the RB1 gene show the pocket domains.
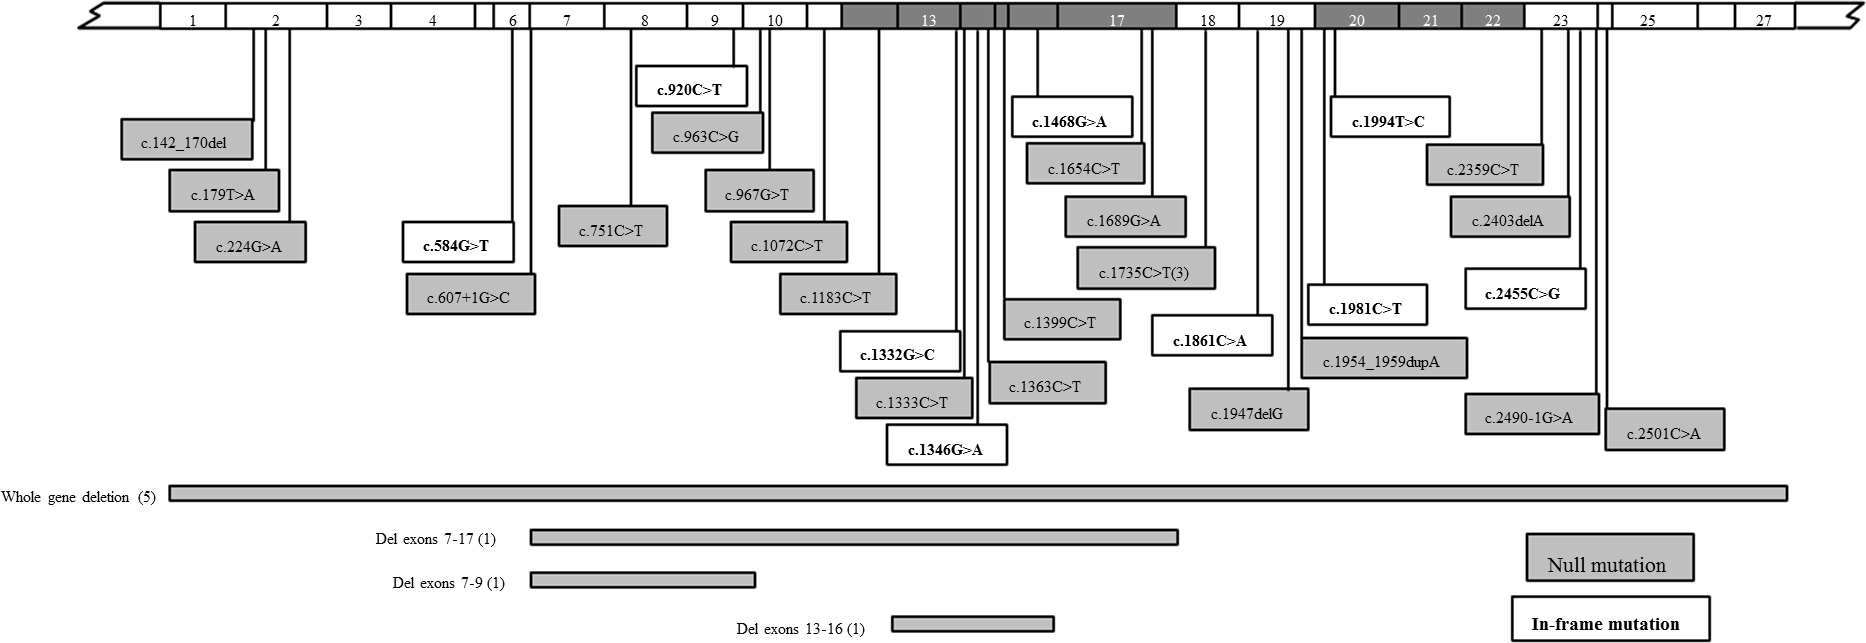
 Figure 1 of
He, Mol Vis 2014; 20:545-552.
Figure 1 of
He, Mol Vis 2014; 20:545-552.