Figure 3. Calcium-independent phospholipase A2, group VIA (iPLA2-VIA) expression and activity are upregulated in ARPE-19 cells exposed to sodium iodate. A: Western blot analysis was performed to detect the expression pattern of iPLA2-VIA and cPLA2-IVA in nonconfluent and confluent ARPE-19 cells exposed to 1mM SI for 24 h. A representative blot is shown (n = 3). B: Bars represent the ratio of the 85 kDa iPLA2-VIA splice variant and cPLA2-IVA protein expression normalized to beta actin expression in nonconfluent ARPE-19 cells. * indicates p < 0.05 ± SD (n=3);
** indicates p<0.01. C: iPLA2-VIA activity in ARPE-19 cells exposed to SI. Bars represent the relative iPLA2-VIA activity in confluent and nonconfluent cells. A tendency for upregulation was found in confluent cells p=0.06 ± SEM (n=3).
* indicates significant difference from its respective control (p<0.05).
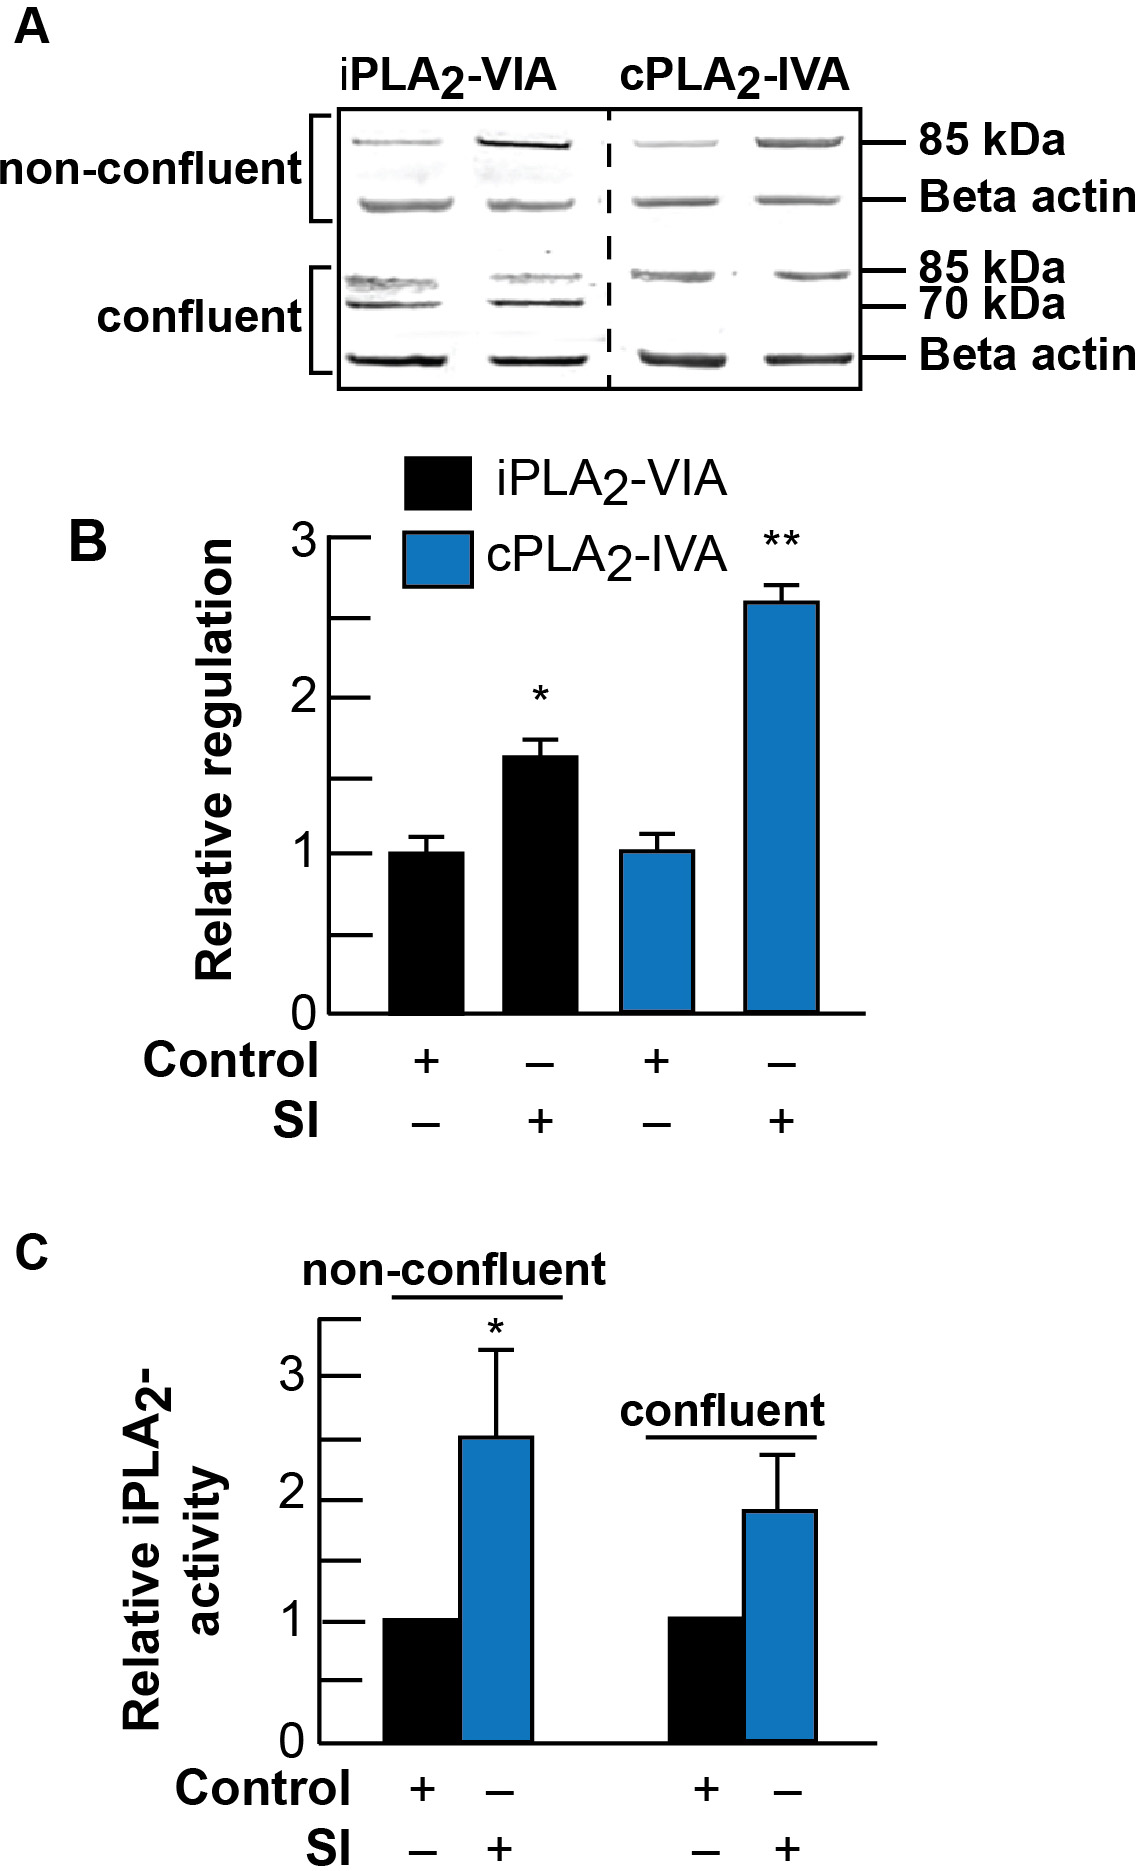
 Figure 3 of
Kolko, Mol Vis 2014; 20:511-521.
Figure 3 of
Kolko, Mol Vis 2014; 20:511-521.