Figure 2. Quantile-quantile (Q-Q) plot of primary angle-closure glaucoma (PACG) genome-wide association (GWA) analysis. A: Scatter plot of the −log10 (p values) expected under the null hypothesis of no genetic association versus the observed −log10
(p values) for all subjects before correction for population stratification using multidimensional scaling analysis (MDS)
generated covariates, and (B) following correction for population stratification using MDS generated covariates. A significant improvement in the initially
observed deviation from normal distribution of all p values as a result of correcting for relatedness and population stratification
effects is observed.
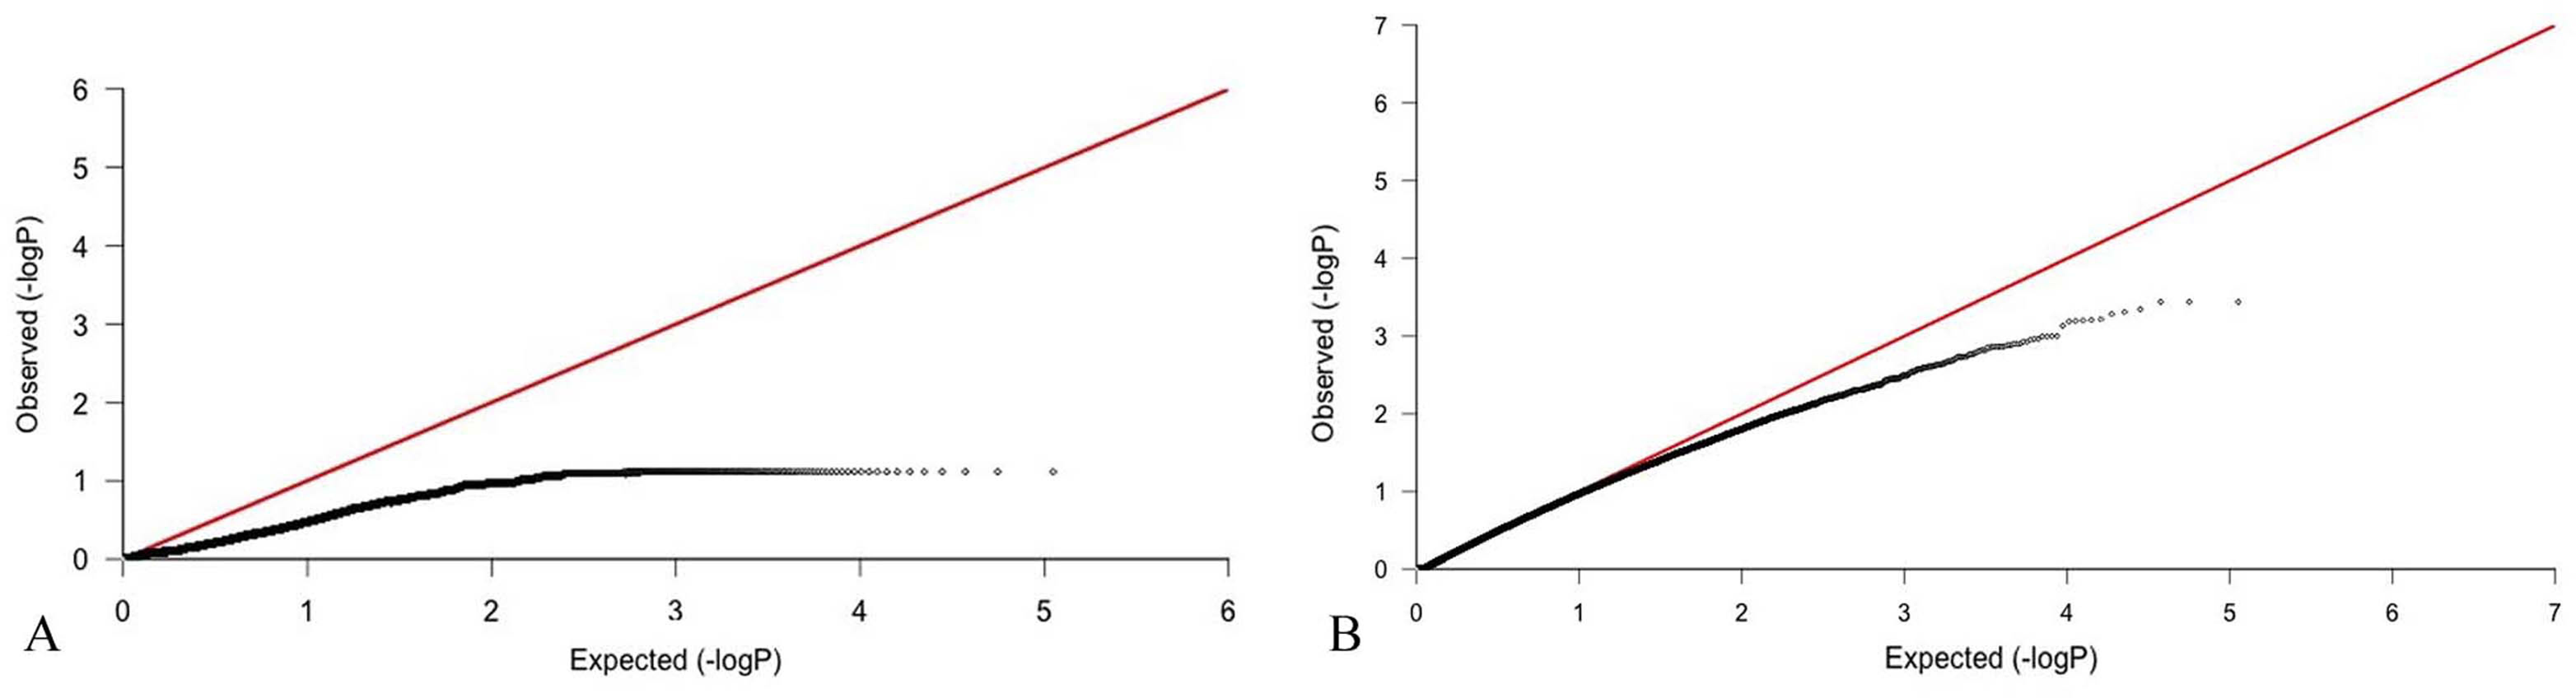
 Figure 2 of
Ahram, Mol Vis 2014; 20:497-510.
Figure 2 of
Ahram, Mol Vis 2014; 20:497-510.