Figure 1. Multidimensional scaling analysis (MDS) scatter plot of cases and controls plotted for the first three MDS dimensions to correct
for relatedness and population stratification. Each dot represents a specific dog. Related and unrelated samples are shown
clustered according to their affiliation with 6 basset hound (BH) primary angle-closure glaucoma (PACG) pedigrees. The group
of unrelated dogs is seen randomly distributed among all pedigree derived samples.
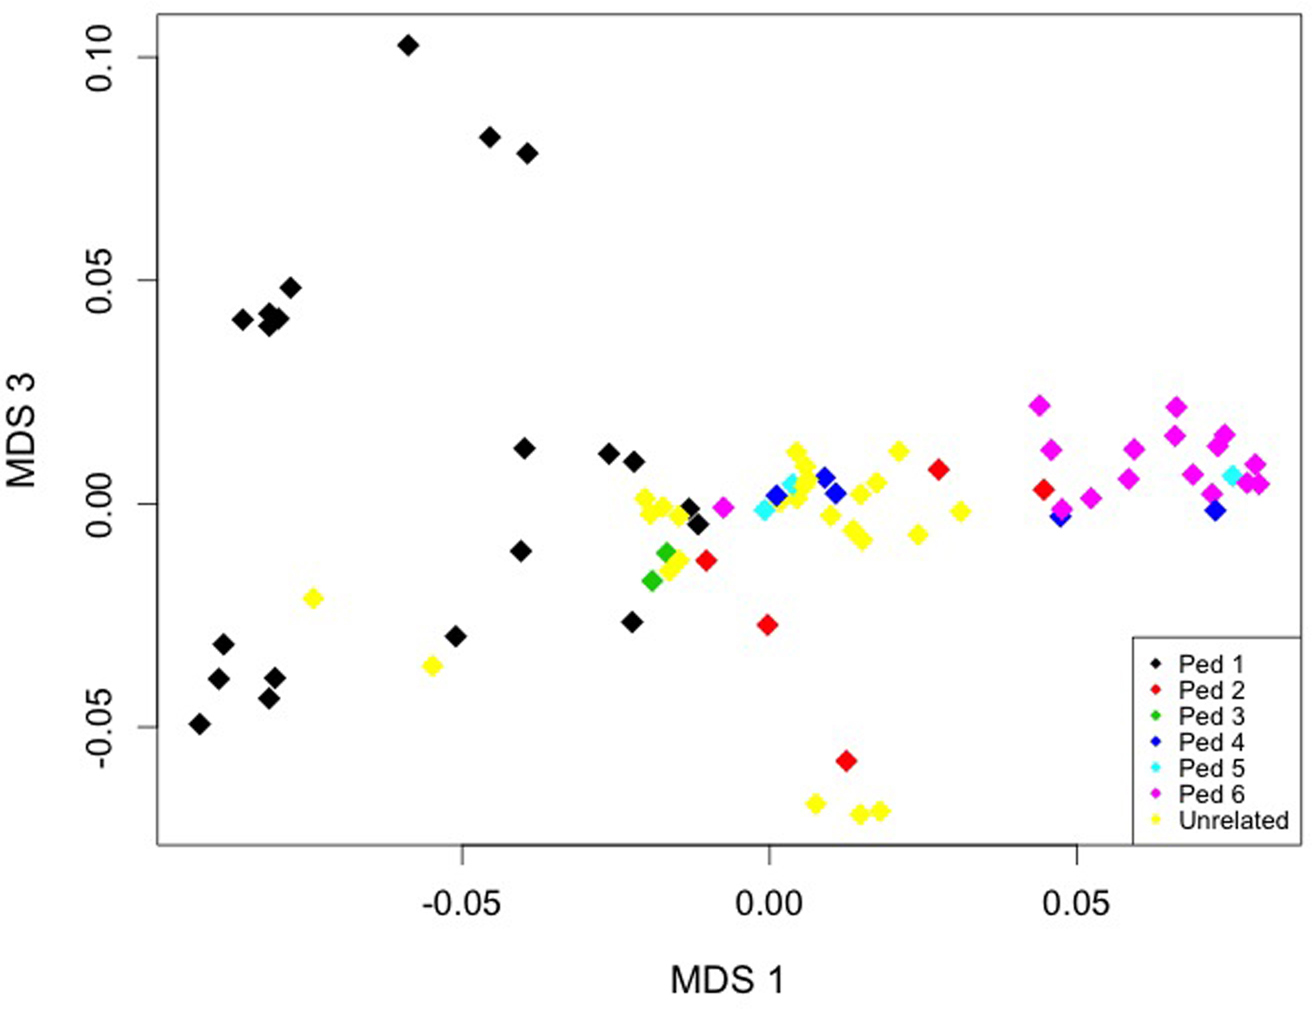
 Figure 1 of
Ahram, Mol Vis 2014; 20:497-510.
Figure 1 of
Ahram, Mol Vis 2014; 20:497-510.