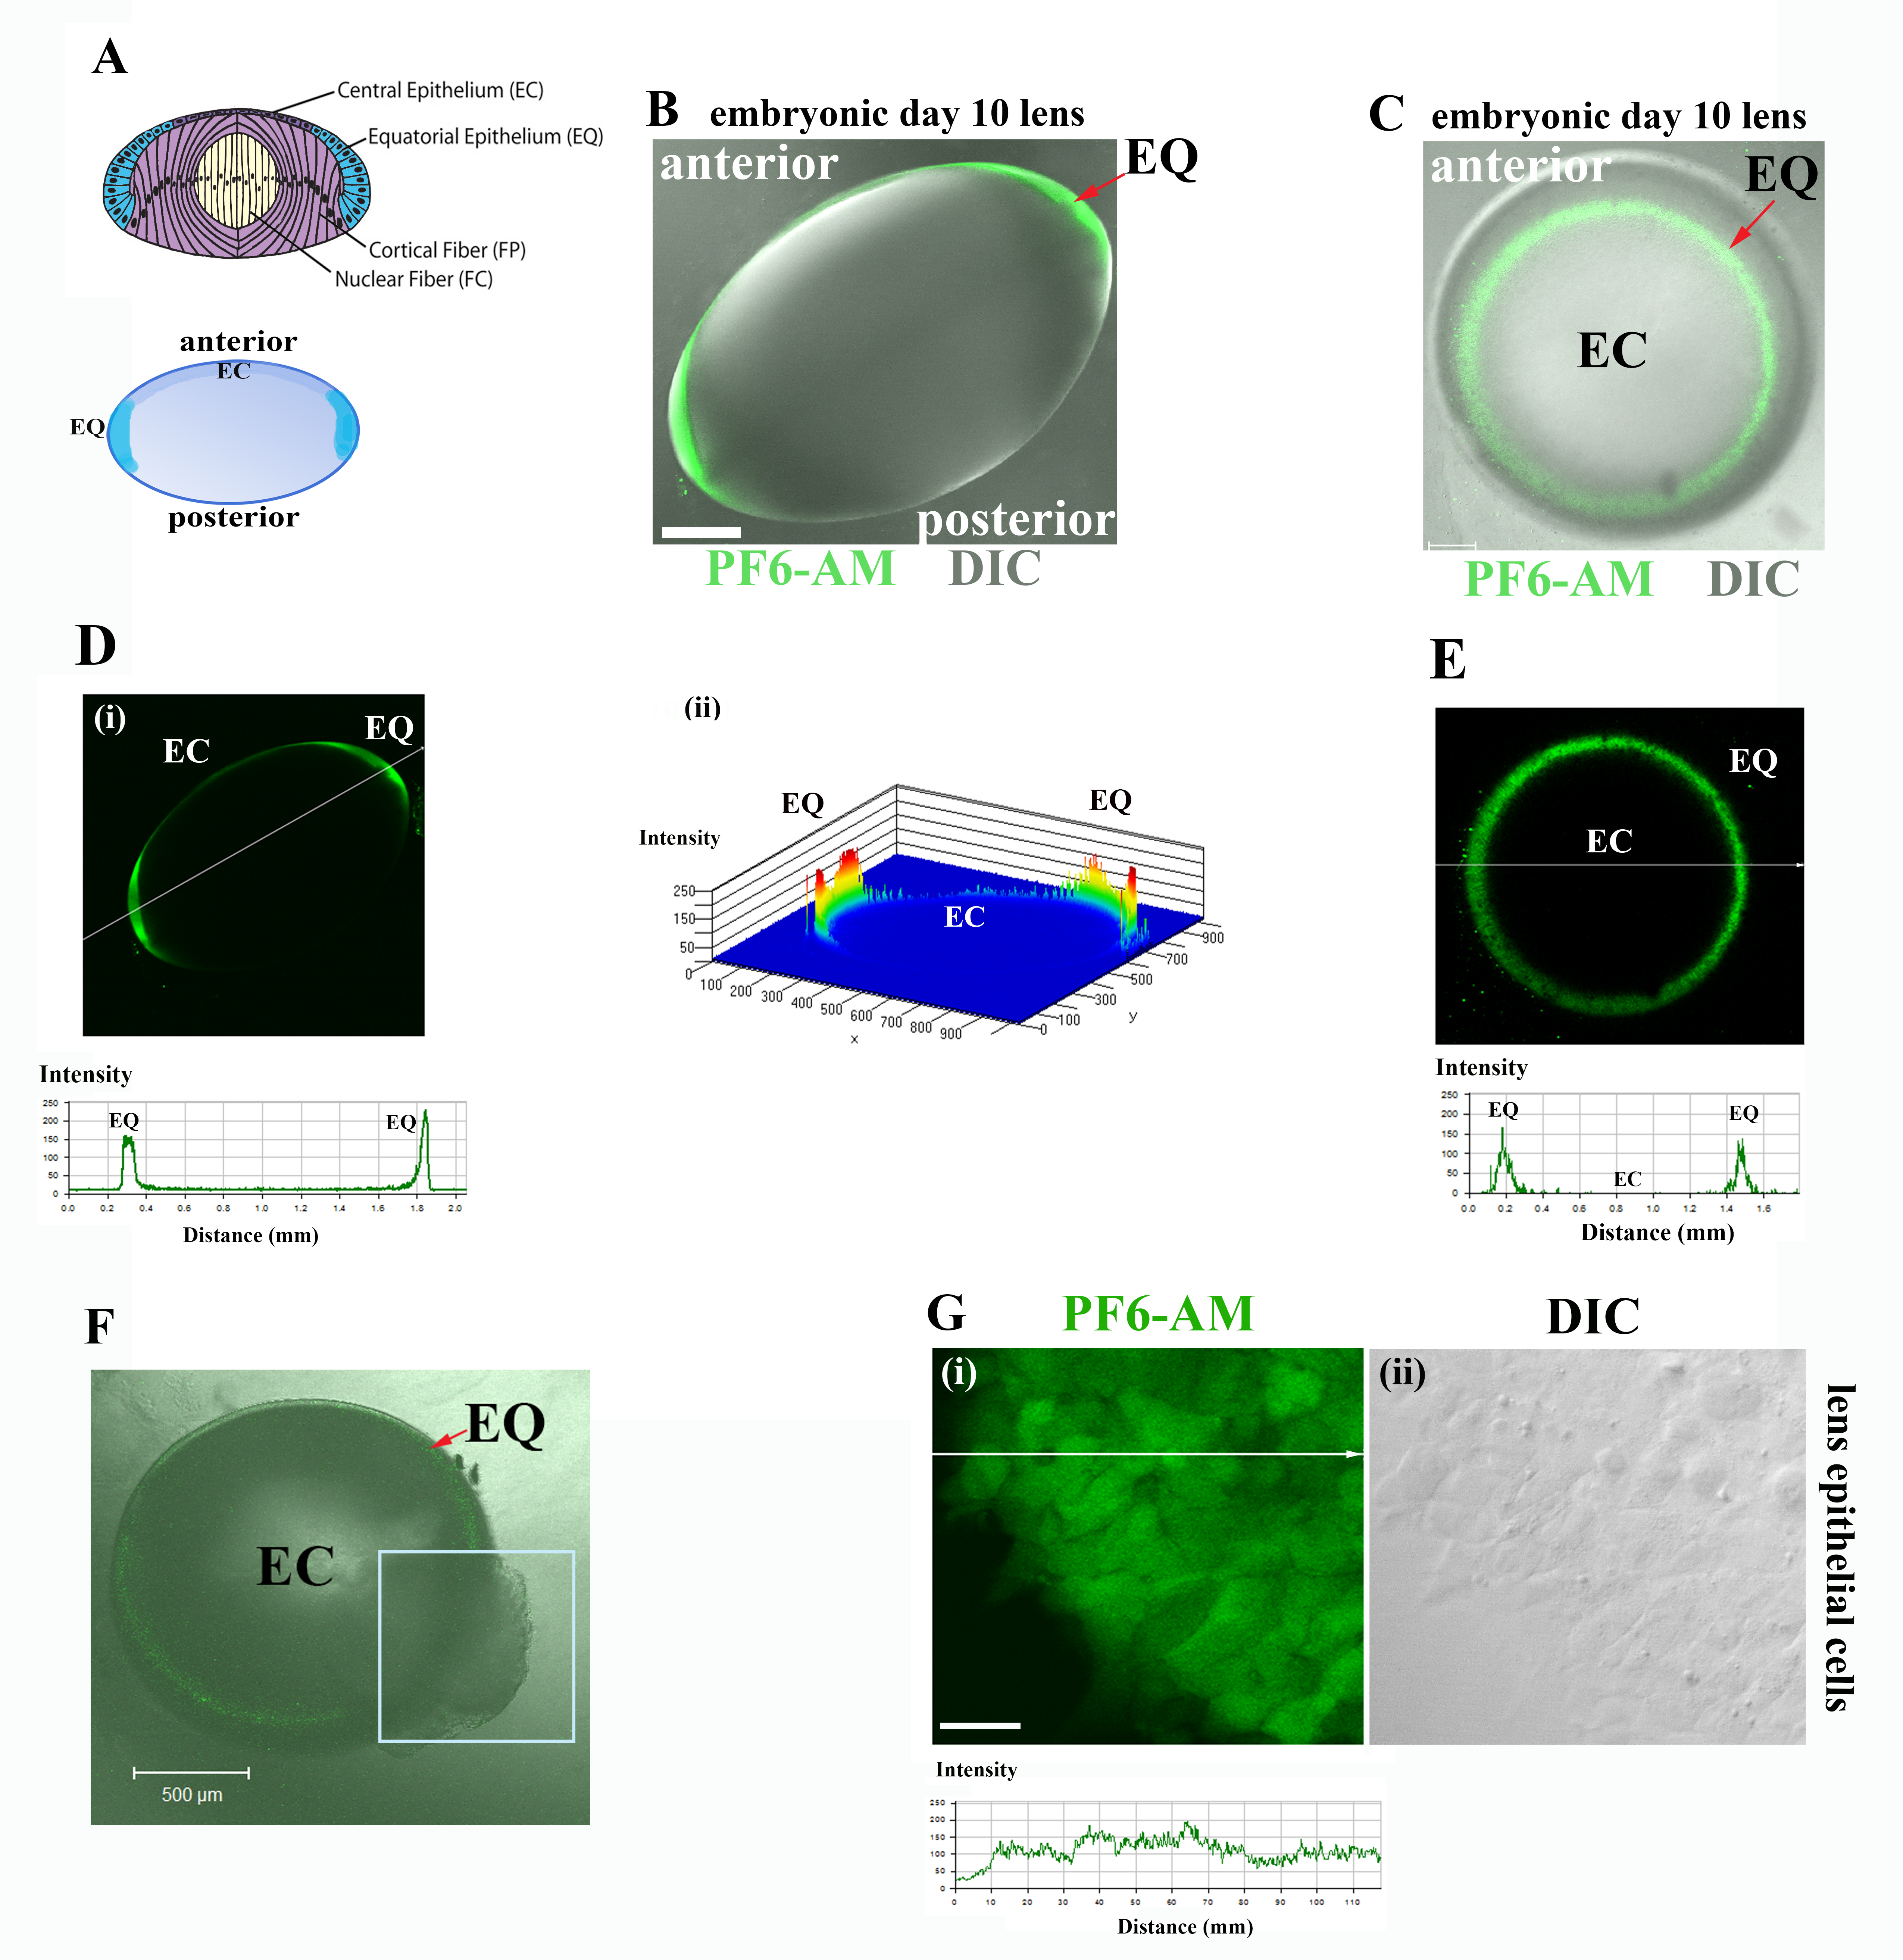
Figure 1. Detection of endogenous hydrogen peroxide (H2O2) in lens cells with peroxyfluor-6 acetoxymethyl ester (PF6-AM). A: Diagram of the embryonic day 10 (E10) chick lens (top panel) depicting four distinct regions of differentiation including:
EC, undifferentiated lens epithelial cells; EQ, equatorial epithelium which is the zone of differentiation initiation; FP,
the zone of lens fiber cell morphogenesis; and FC, the zone of fiber cell maturation. Lens model highlighting the EC and EQ
zones (blue, bottom panel). B: E10 chick lens placed in organ culture and loaded with PF6-AM (green) to detect endogenous H2O2 production, shown as an overlay of PF6-AM (green) to detect endogenous H2O2 production, and the differential interference contrast (DIC) image. Whole lens was viewed live from the equatorial region
providing an anterior–posterior view. The detection of H2O2 production was limited to the lens epithelium and was highest in the EQ zone. C: E10 chick lens exposed to PF6-AM (green) and viewed en-face as an overlay with DIC, demonstrating H2O2 production was greatest in the EQ zone. D: Line scan intensity analysis across the image profile from (B) (created using LSM5 Image Examiner along [i] an EQ to EQ line) to quantify the level of H2O2 production showed that highest intensity labeling for endogenous H2O2 occurred in the EQ zone of the lens. (ii) Surface plot histogram (plotted against EC and EQ zones of the lens in B) showing the relative intensities of the H2O2 signal across the lens confirmed that the greatest endogenous H2O2 production occurred in the EQ zone. E: Line scan intensity analysis across the image profile from (C) demonstrated that the greatest production of endogenous H2O2 occurred in the EQ zone. F: E10 lens with a puncture in the equatorial region (boxed area) incubated with PF6-AM and imaged en-face as an overlay with
the DIC image. Results confirmed the specificity of H2O2 production to the lens epithelium, as detected by PF6-AM. G: (i) Primary lens epithelial cells in culture loaded with PF6-AM showed production of endogenous H2O2 (PF6-AM, green); (ii): DIC of image shown in (i). Panel just below (i) shows the line scan intensity analysis for H2O2 in lens epithelial cells in (i). Images were acquired live by confocal microscopy. Each optical slice is 3 μM in thickness
in (B) and (C); scale bar = 200 μm. Optical slice thickness for images (F) and (G) is 1 μm; scale bar in (F) is 500 μm and in (G) is 20 μm. Results are representative of three independent experiments. Studies provided direct evidence for the presence
of endogenous H2O2 in lens epithelial cells.

 Figure 1 of
Basu, Mol Vis 2014; 20:458-467.
  Figure 1 of
Basu, Mol Vis 2014; 20:458-467.