Figure 8. Expression of each Hsp was significantly correlated with the others. A: Scatter plot graph comparing the LIs for Hsp70 and Hsp90. B: Scatter plot graph comparing the LIs for Hsp27 and Hsp90. C: Scatter plot graph comparing the LIs for Hsp27 and Hsp70. The significance level was defined as p<0.05.
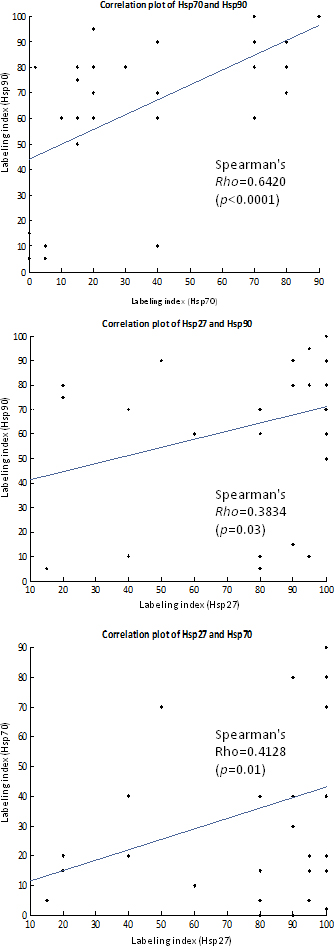
 Figure 8 of
Pagoulatos, Mol Vis 2014; 20:441-457.
Figure 8 of
Pagoulatos, Mol Vis 2014; 20:441-457.