Figure 7. A highly significant relationship, between HIF-1α and Hsp LIs and between pVHL and Hsp90/Hsp70 LIs was revealed with correlation
analysis. A-C: Scatter plot graph comparing the LIs for Hsps (Hsp90, Hsp70, and Hsp27) and HIF-1α in pterygium samples included in the
study. D, E: Scatter plot graph comparing the LIs for Hsps (Hsp90 and Hsp70) and pVHL in pterygium samples included in the study. F: Scatter plot graph comparing the LIs for HIF-1α and pVHL in pterygium samples included in the study. The significance level
was defined as p<0.05.
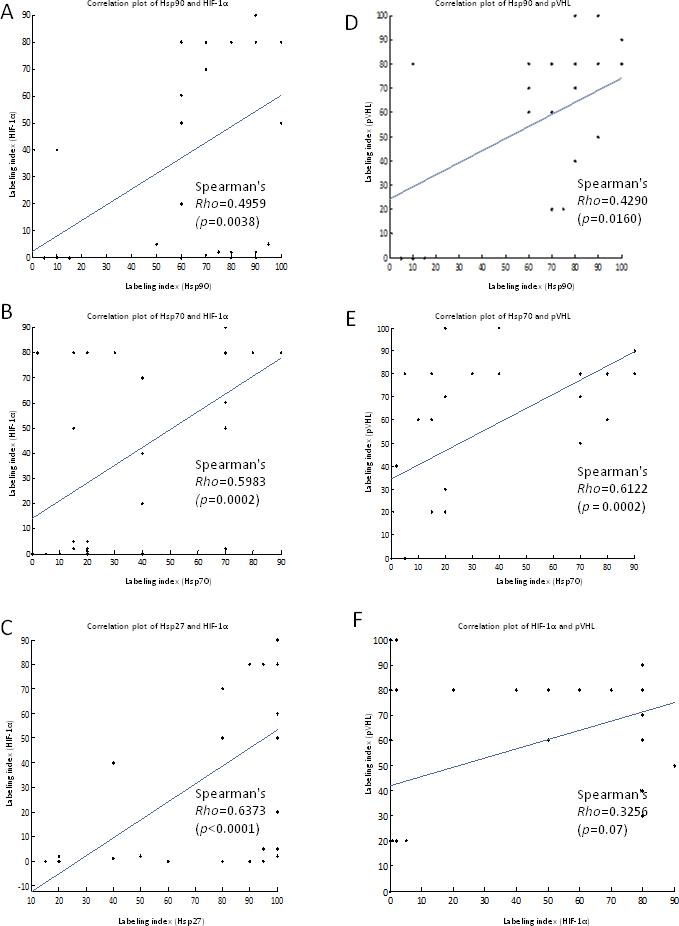
 Figure 7 of
Pagoulatos, Mol Vis 2014; 20:441-457.
Figure 7 of
Pagoulatos, Mol Vis 2014; 20:441-457.