Figure 1. Panel depicting the cellular distribution of HIF-1α in pterygia (A-C,E) and normal conjunctiva (D). A: Strong nuclear immunoreactivity in numerous epithelial cells of pterygium. B: Strong nuclear and cytoplasmic immunoreactivity in all epithelial layers of pterygium sample. C: The basal epithelial cells are HIF-1α negative whereas the remaining cells display nuclear and cytoplasmic immunoreactivity
in this pterygium sample. D: Arrow indicates a single cell with weak cytoplasmic immunoreactivity for HIF-1α in normal conjunctival epithelium. E: HIF-1α positive cells, with nuclear and cytoplasmic immunoreactivity, are adjacent to HIF-1α negative cells, highlighting
the staining heterogeneity within individual tissues. (Dako Envision Plus Detection System with hematoxylin counterstain,
original magnification X400, bar 50 μm).
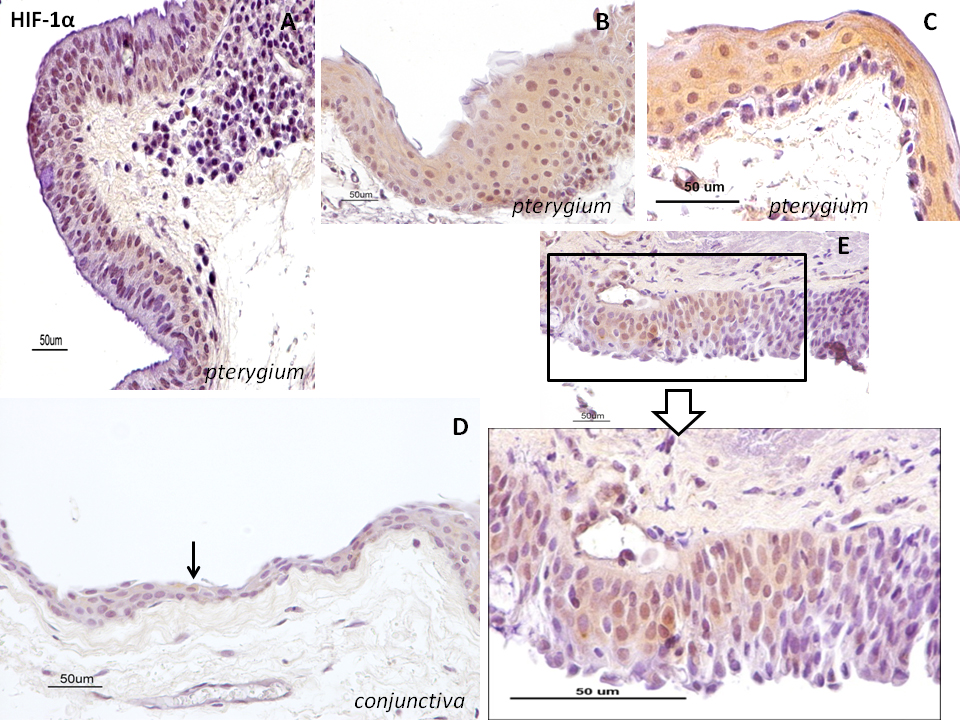
 Figure 1 of
Pagoulatos, Mol Vis 2014; 20:441-457.
Figure 1 of
Pagoulatos, Mol Vis 2014; 20:441-457.