Figure 7. Allometric analysis of the relationship of the lens growth constant to different parameters. Comparisons were made with maximum
lens dry weight (A), maximum possible life span (B), normal maximum bodyweight (C), and gestational period (D) in warm-blooded species. Data for the species that appear to exhibit biphasic growth have been omitted. Data for related
species are shown in the same colors: bats (black), birds (light blue), carnivores (red), lagomorphs (purple), marsupials
(dark green), primates (light green), rodents (orange with black outline), tree shrew (light green with black outline), and
ungulates (dark blue).
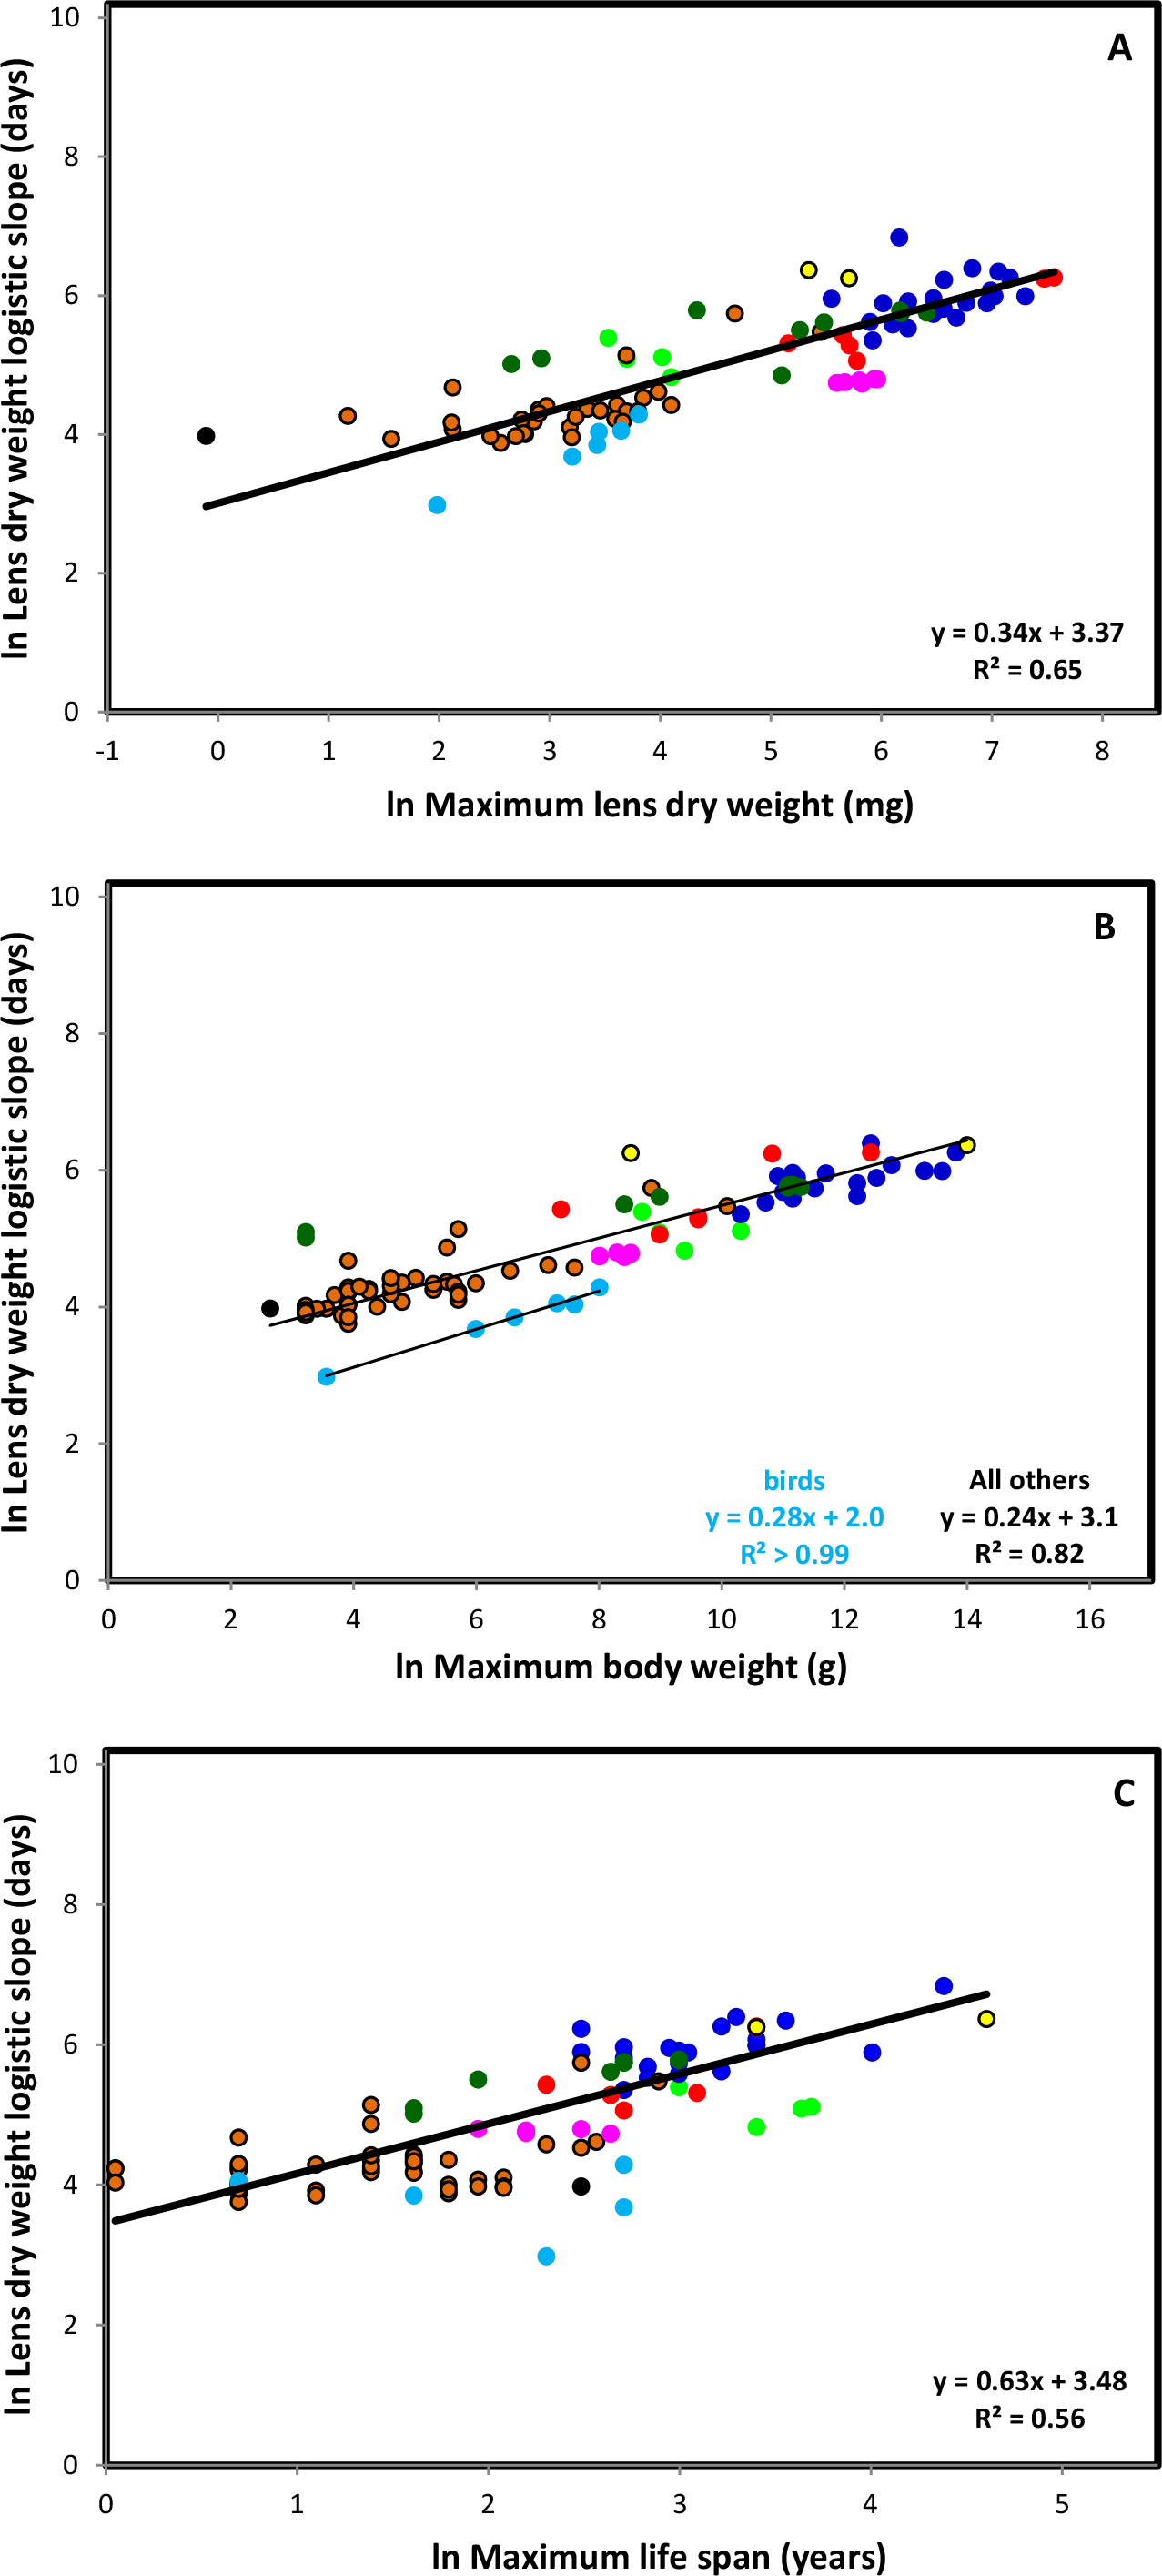
 Figure 7 of
Augusteyn, Mol Vis 2014; 20:410-426.
Figure 7 of
Augusteyn, Mol Vis 2014; 20:410-426.