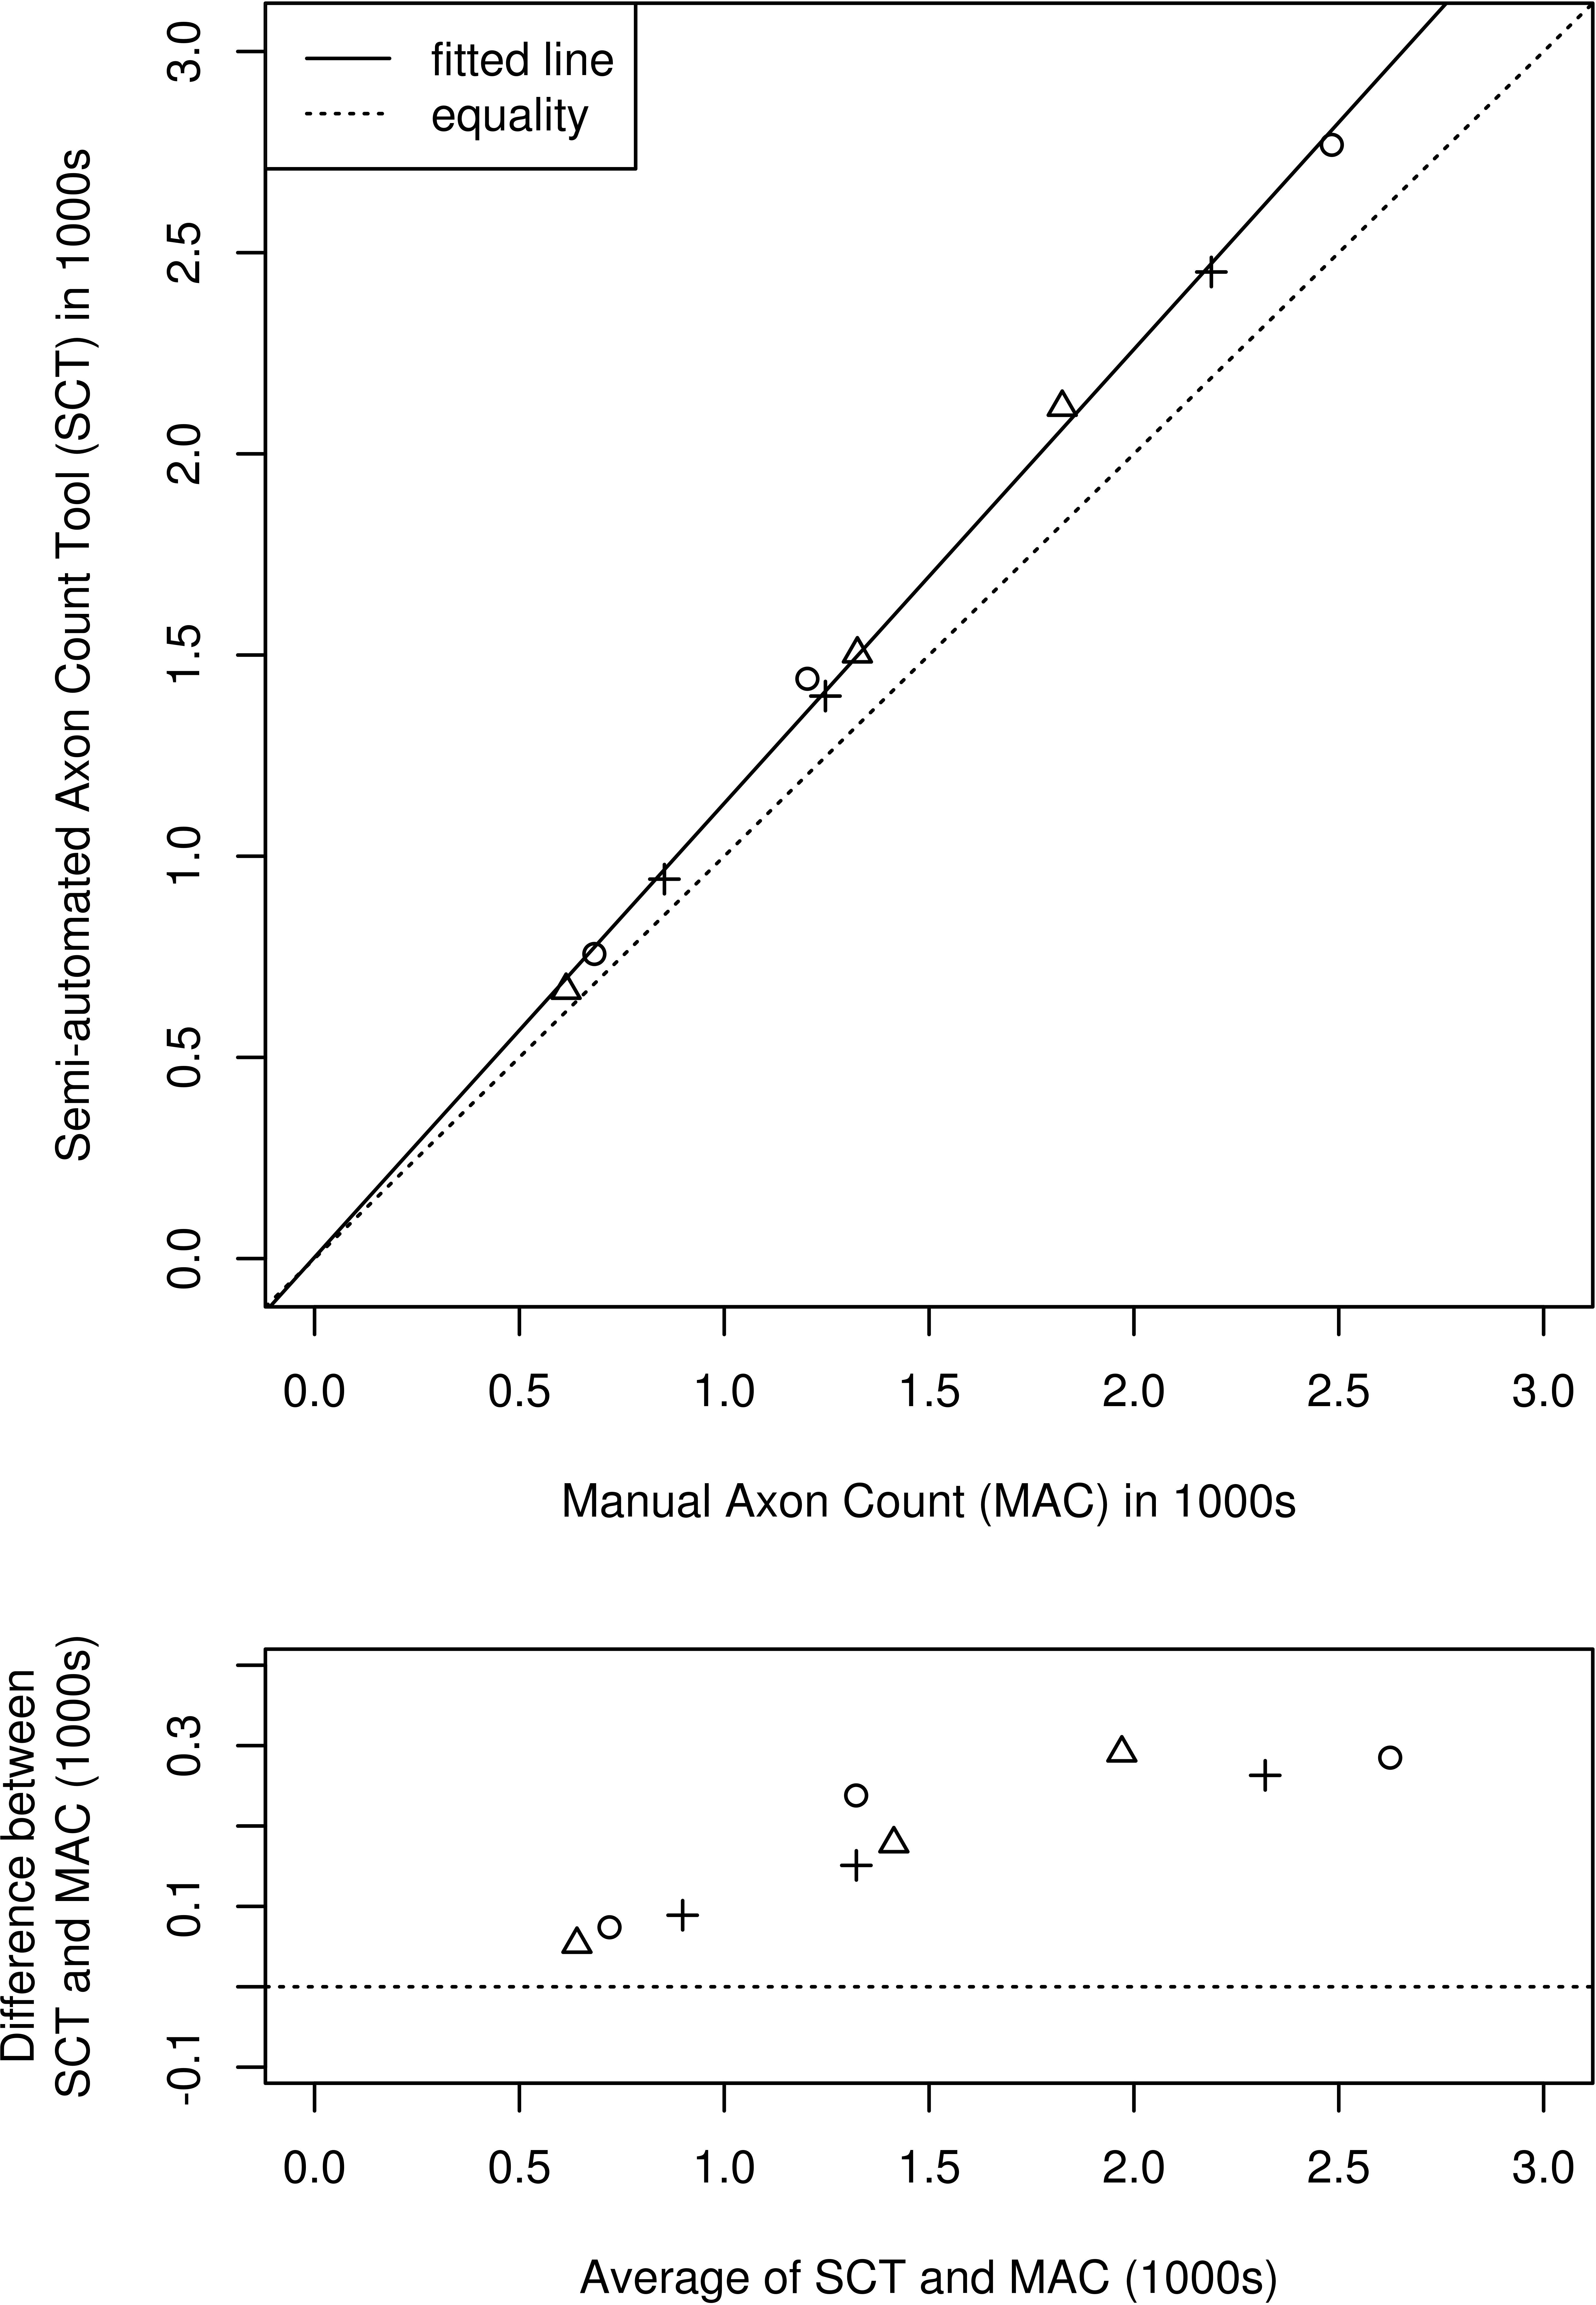
Figure 3. Degree of agreement between semi-automated axon count tool (SCT) and manual axon count (MAC) methods. The top panel shows
a scatter plot of SCT versus MAC counts for n=9 fields, one each of low, medium, and high density selected from each of three
animals (designated by three different plotting symbols). The dotted line represents equality of counting methods, and the
solid line represents the best linear fit. The bottom panel shows a Bland-Altman plot of the difference versus the average
of the two counting methods.

 Figure 3 of
Teixeira, Mol Vis 2014; 20:376-385.
  Figure 3 of
Teixeira, Mol Vis 2014; 20:376-385.