Figure 2. Selections of regions with homogeneous damage in an optic nerve cross section from a glaucomatous cat. Images A, B, and C depict region selection by three different raters in the same optic nerve section. The blue region labeled (1) represents
a normal region, the green region labeled (2) a moderately damaged region, and the red region labeled (3) a severely damaged
region. Note the variation of the selected areas by the different raters and the final area of each region in μm2. The scale bar = 100 μm.
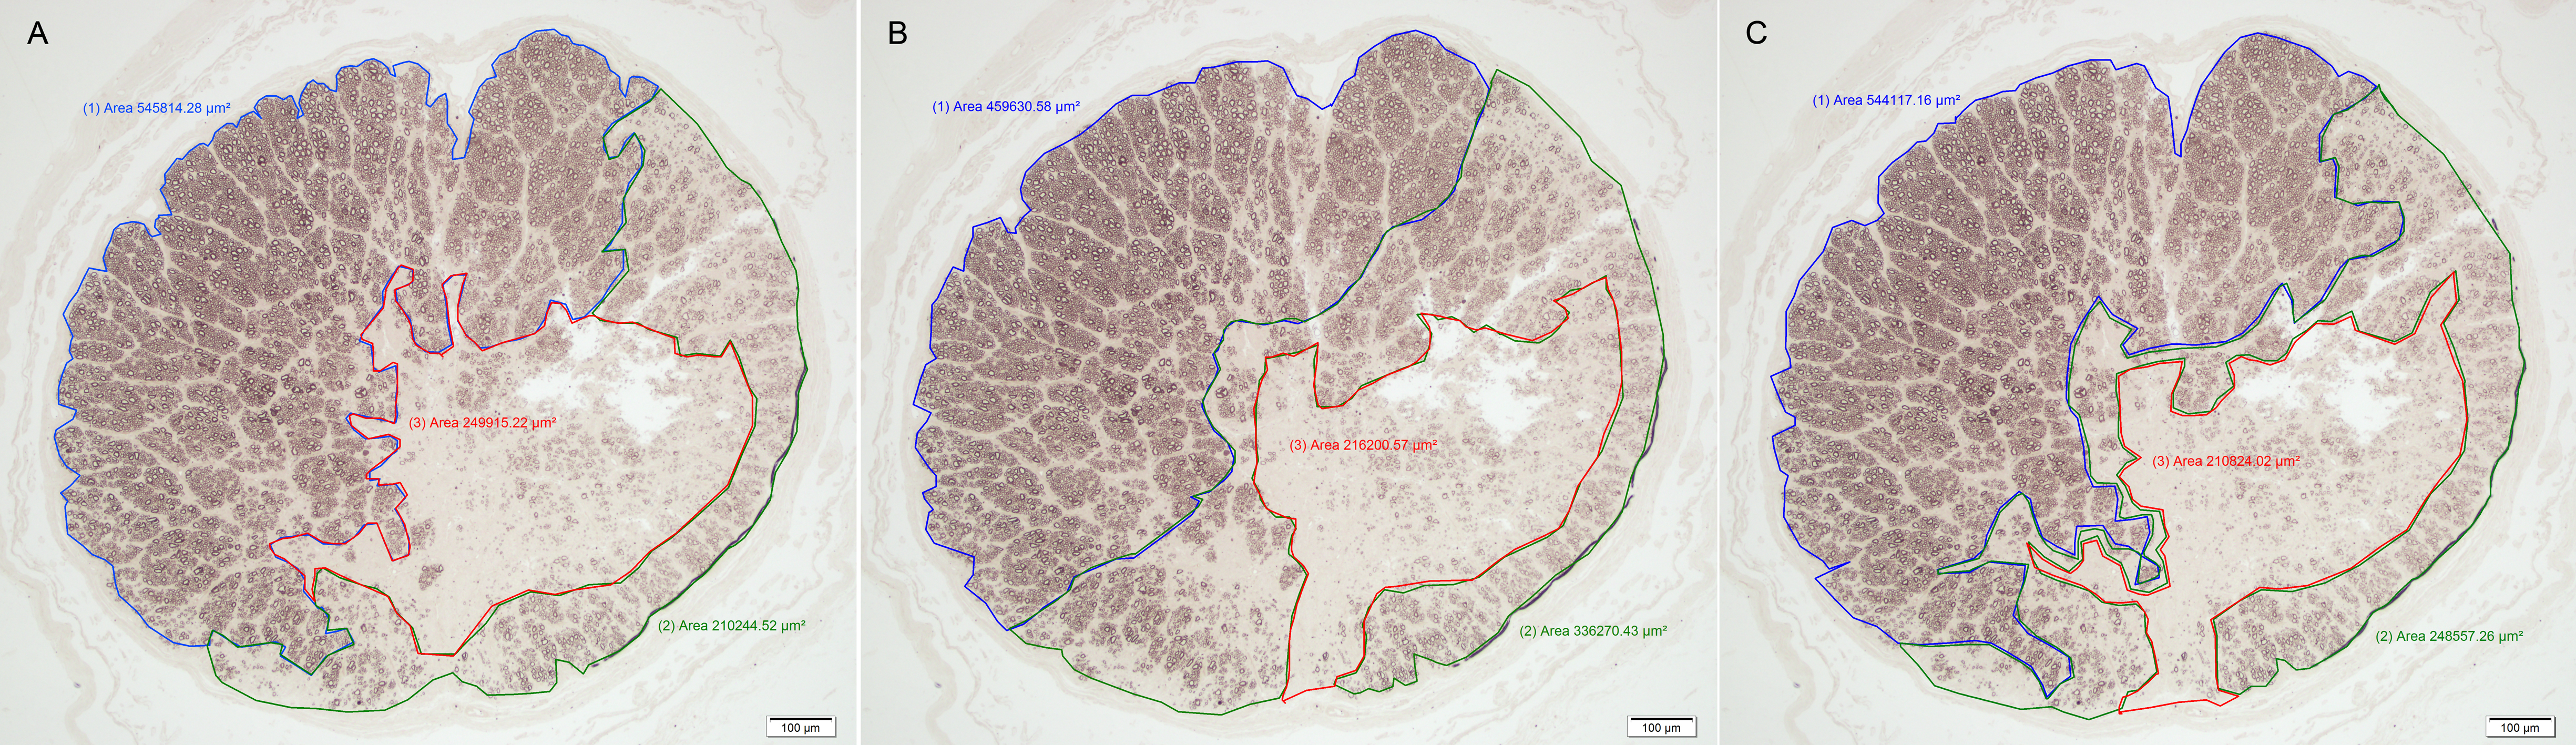
 Figure 2 of
Teixeira, Mol Vis 2014; 20:376-385.
Figure 2 of
Teixeira, Mol Vis 2014; 20:376-385.