Figure 1. Semi-automated counting tool used in axon detection and quantification. Histologic sections of the optic nerves from affected
cats. The images represent three distinct areas of the optic nerves judged as normal or densely populated (A), moderately damaged (C), and severely damaged (E). Images B, D and F represent the corresponding images after semi-automated axon detection was performed using the image analysis software. The
contour of the black-stained axon myelin sheath is highlighted in red and automatically counted by the software. The scale
bar = 20 μm.
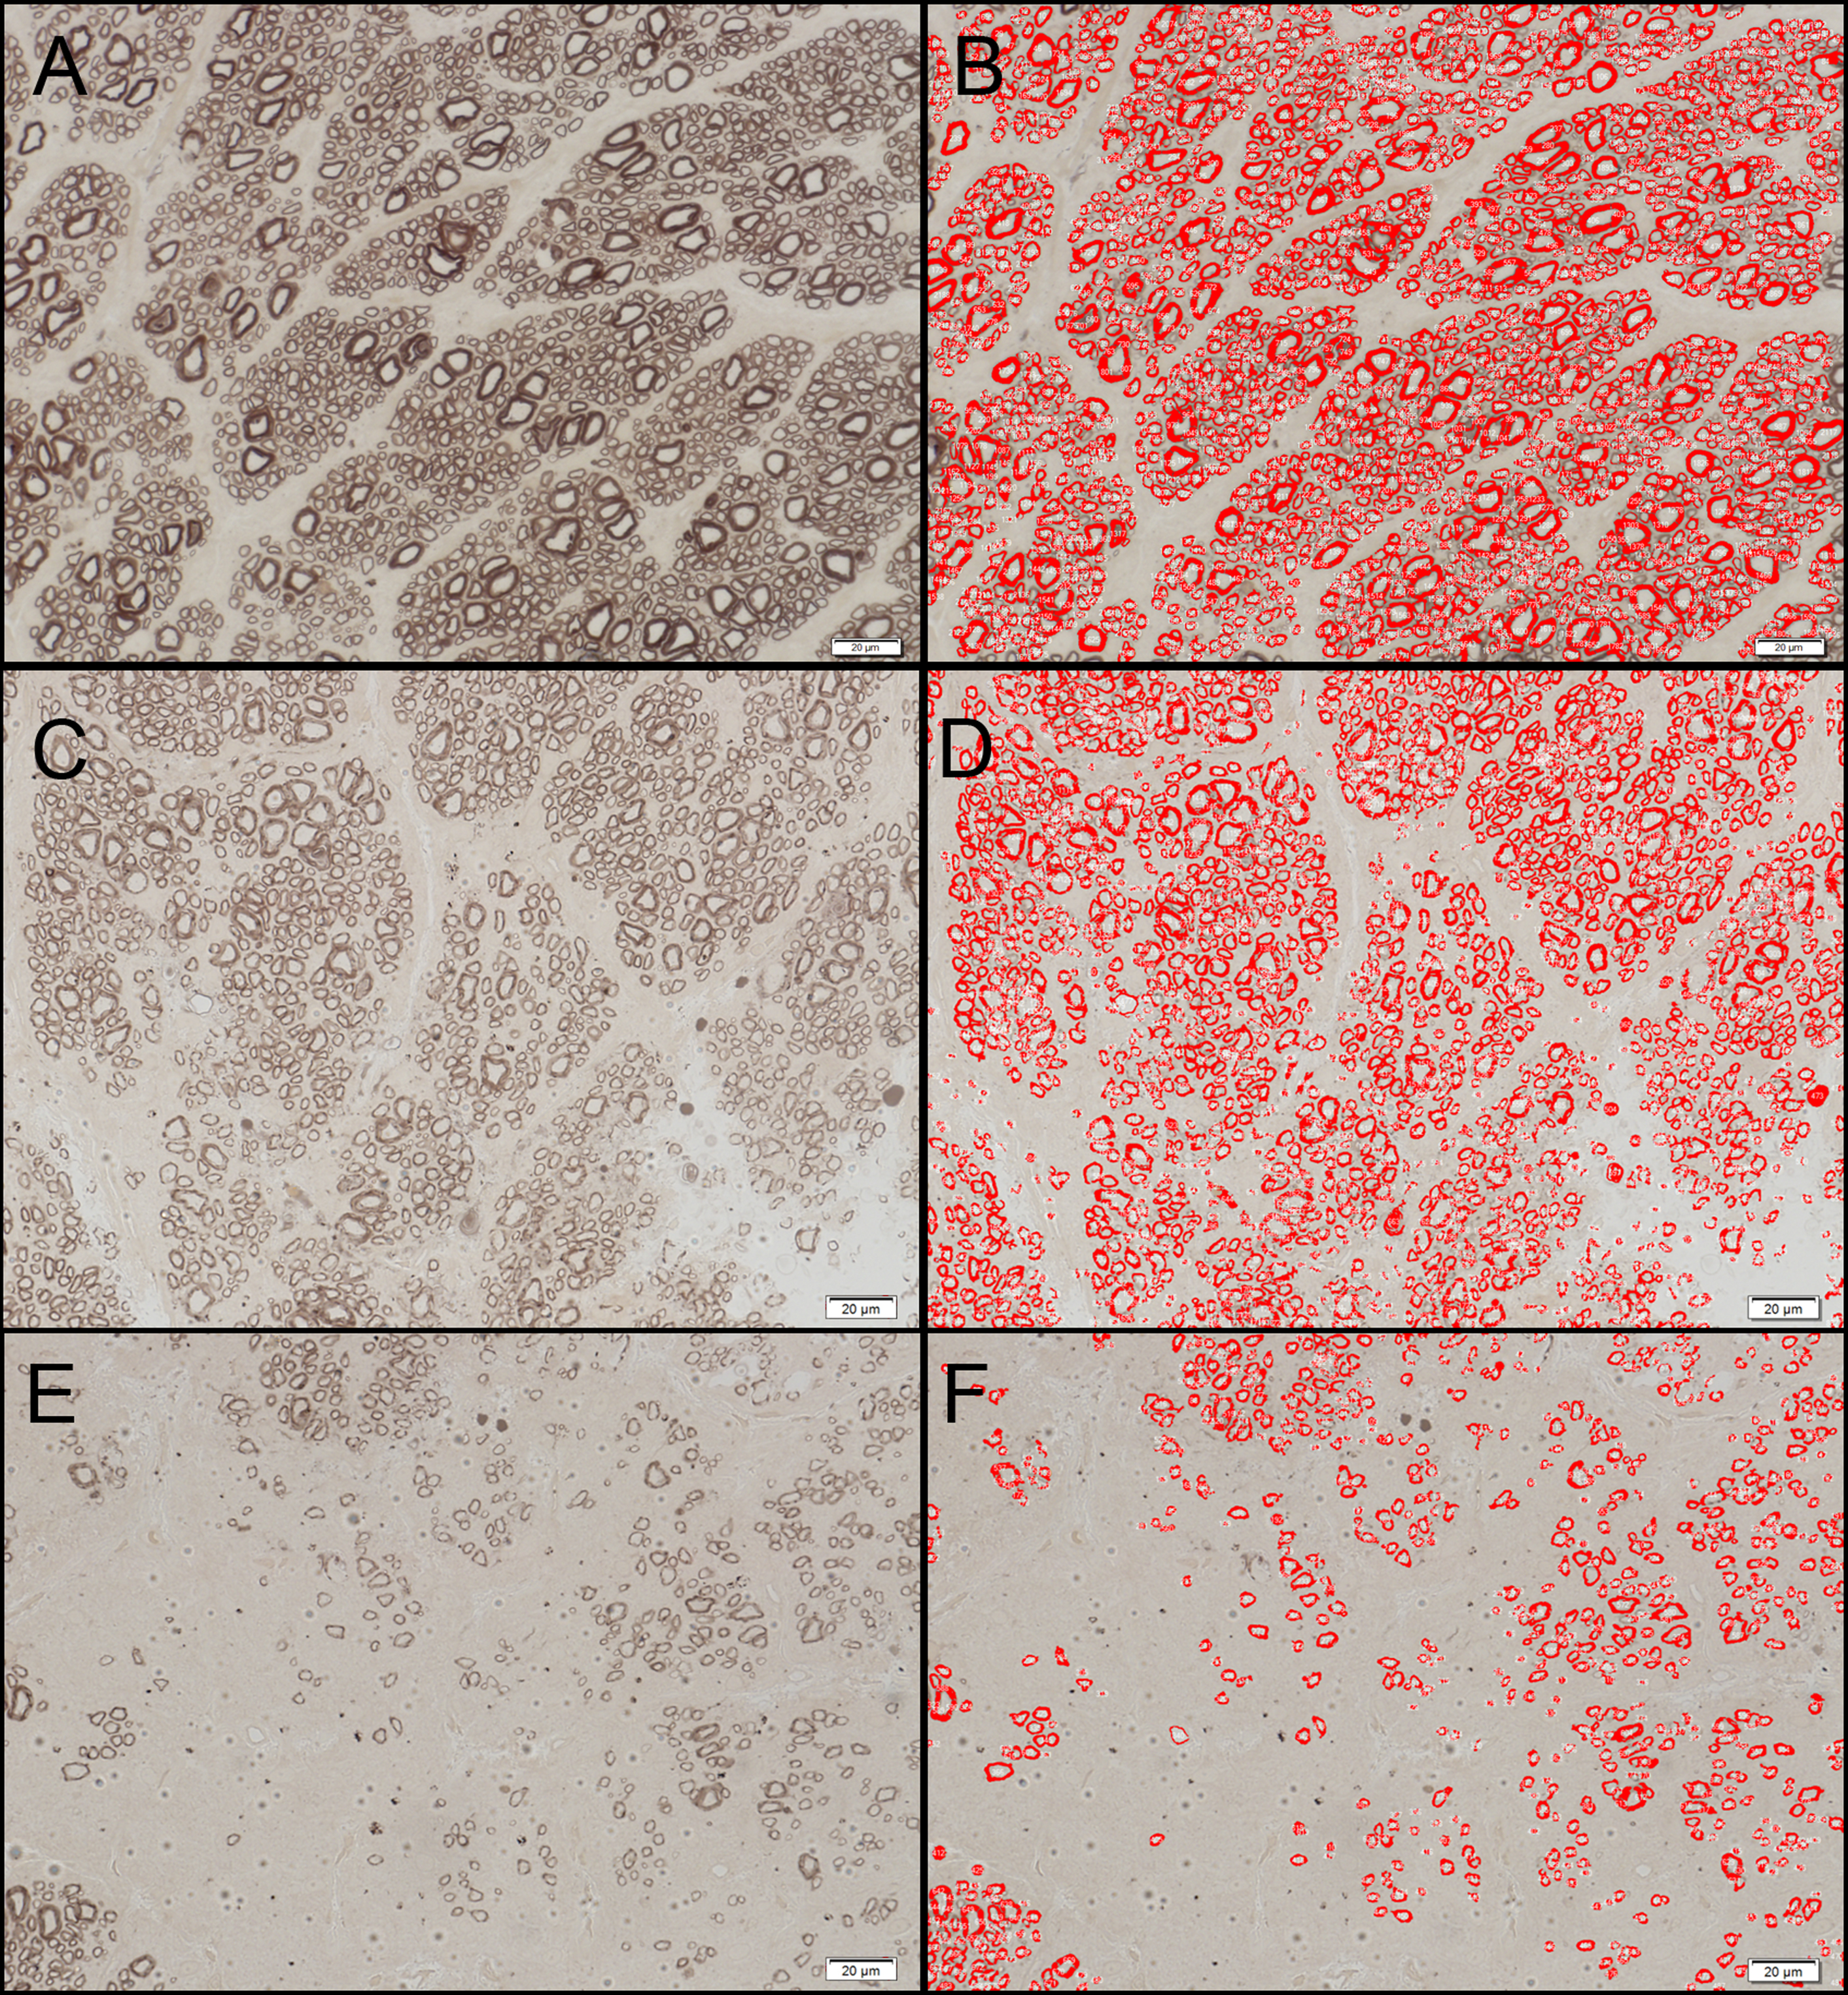
 Figure 1 of
Teixeira, Mol Vis 2014; 20:376-385.
Figure 1 of
Teixeira, Mol Vis 2014; 20:376-385.