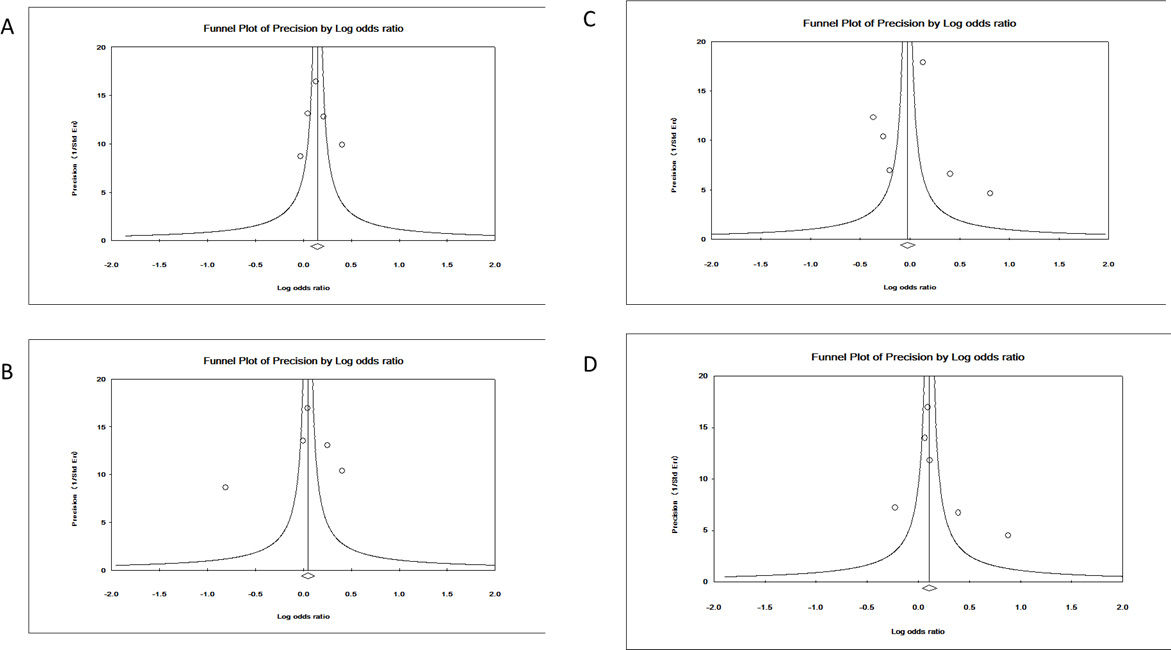
Figure 4. Egger’s funnel plots of publication bias analysis for the polymorphisms.
A:
rs11218544,
B:
rs677948,
C:
rs6885224,
D:
rs12716080. The larger the deviation from the funnel curve of each study, the more pronounced the asymmetry. Results from small studies
scatter widely at the bottom of the graph, with the spread narrowing among larger studies.
 Figure 4 of
Liu, Mol Vis 2014; 20:352-358.
Figure 4 of
Liu, Mol Vis 2014; 20:352-358.