Figure 3 of
Liu, Mol Vis 2014; 20:352-358.
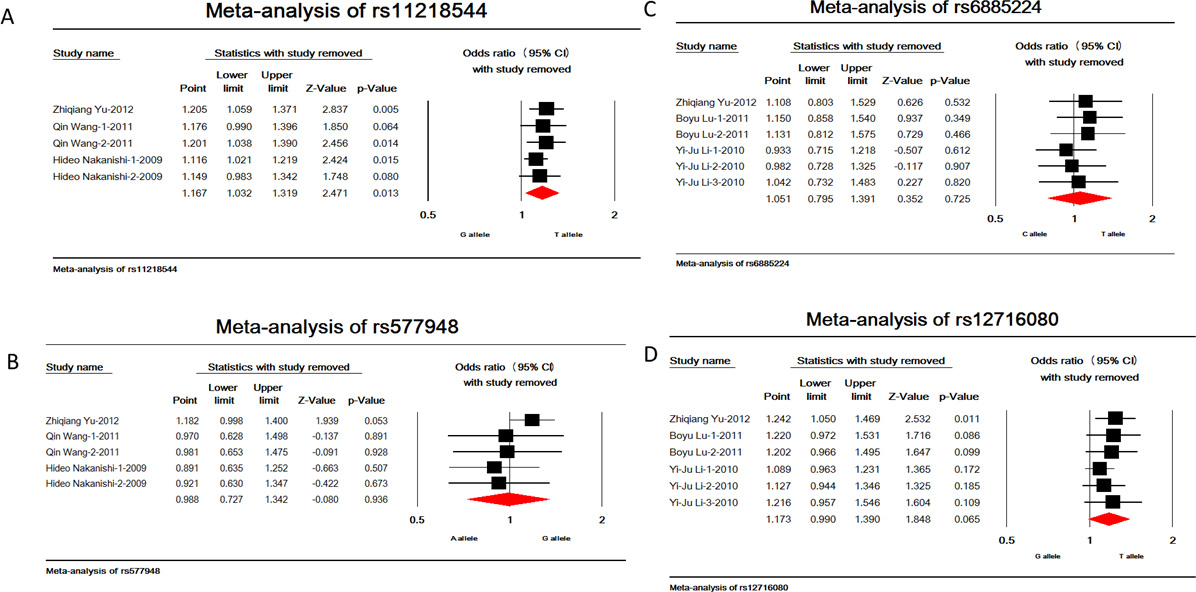
Figure 3.
The sensitivity analysis of the polymorphisms.
A
:
rs11218544
,
B
:
rs677948
,
C
:
rs6885224
,
D
:
rs12716080
. When any one of the studies was removed, the heterogeneity of the population remained unchanged.
 Figure 3 of
Liu, Mol Vis 2014; 20:352-358.
Figure 3 of
Liu, Mol Vis 2014; 20:352-358.