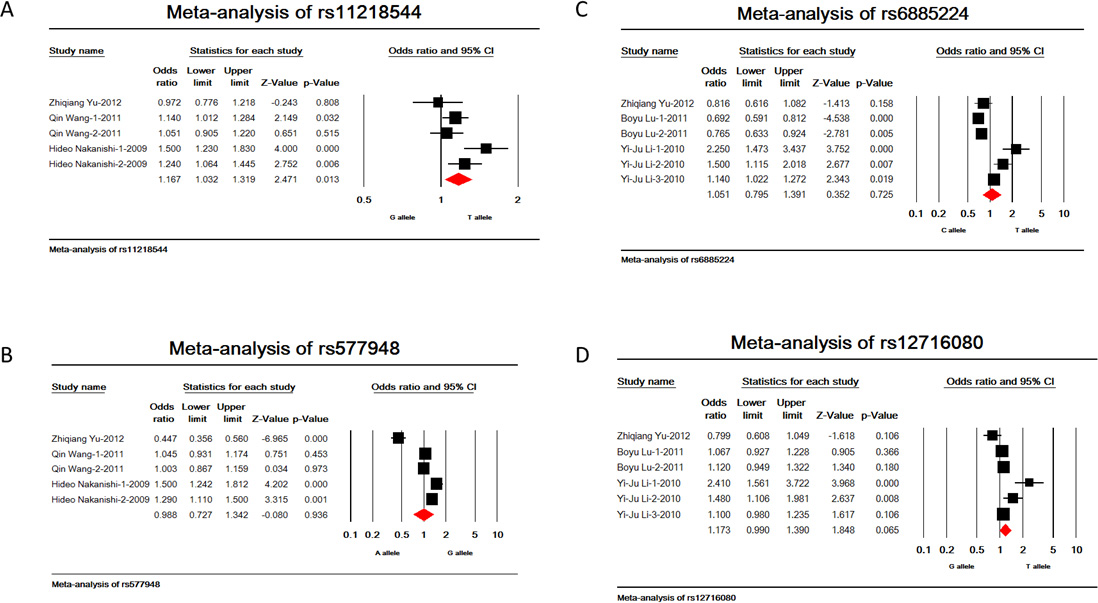
Figure 2. Meta-analysis of association studies of the polymorphisms and myopia.
A:
rs11218544,
B:
rs677948,
C:
rs6885224,
D:
rs12716080. Pooled overall OR is shown. The OR of each study is marked with a black square. Pooled OR is indicated by a red diamond.
 Figure 2 of
Liu, Mol Vis 2014; 20:352-358.
Figure 2 of
Liu, Mol Vis 2014; 20:352-358.