Figure 2. Pedigree, sequence chromatogram traces and conserved amino acid residues of the eight cCSNB families. The squares and the
circles in the pedigree represent men and women, respectively, and the filled-in squares and circles represent affected men
and women, respectively. The red line above the individuals in the pedigree indicates genotype data are available. The sequence
chromatogram trace shows the region of the mutation as seen in the affected individuals. M1–M8 represent the eight mutations
identified in the eight families. A–F: Families with mutations in the TRPM1 gene. G: The pedigree and the sequence chromatogram of the index patient with a mutation in GRP179 are shown. H: The pedigree and the mutation identified in the index patient with GRM6 are shown. The wild-type sequence chromatogram trace is shown adjacent to the mutant chromatogram trace. The conservation
of the wild-type amino acid codon across the vertebrates is also shown for the missense mutations.
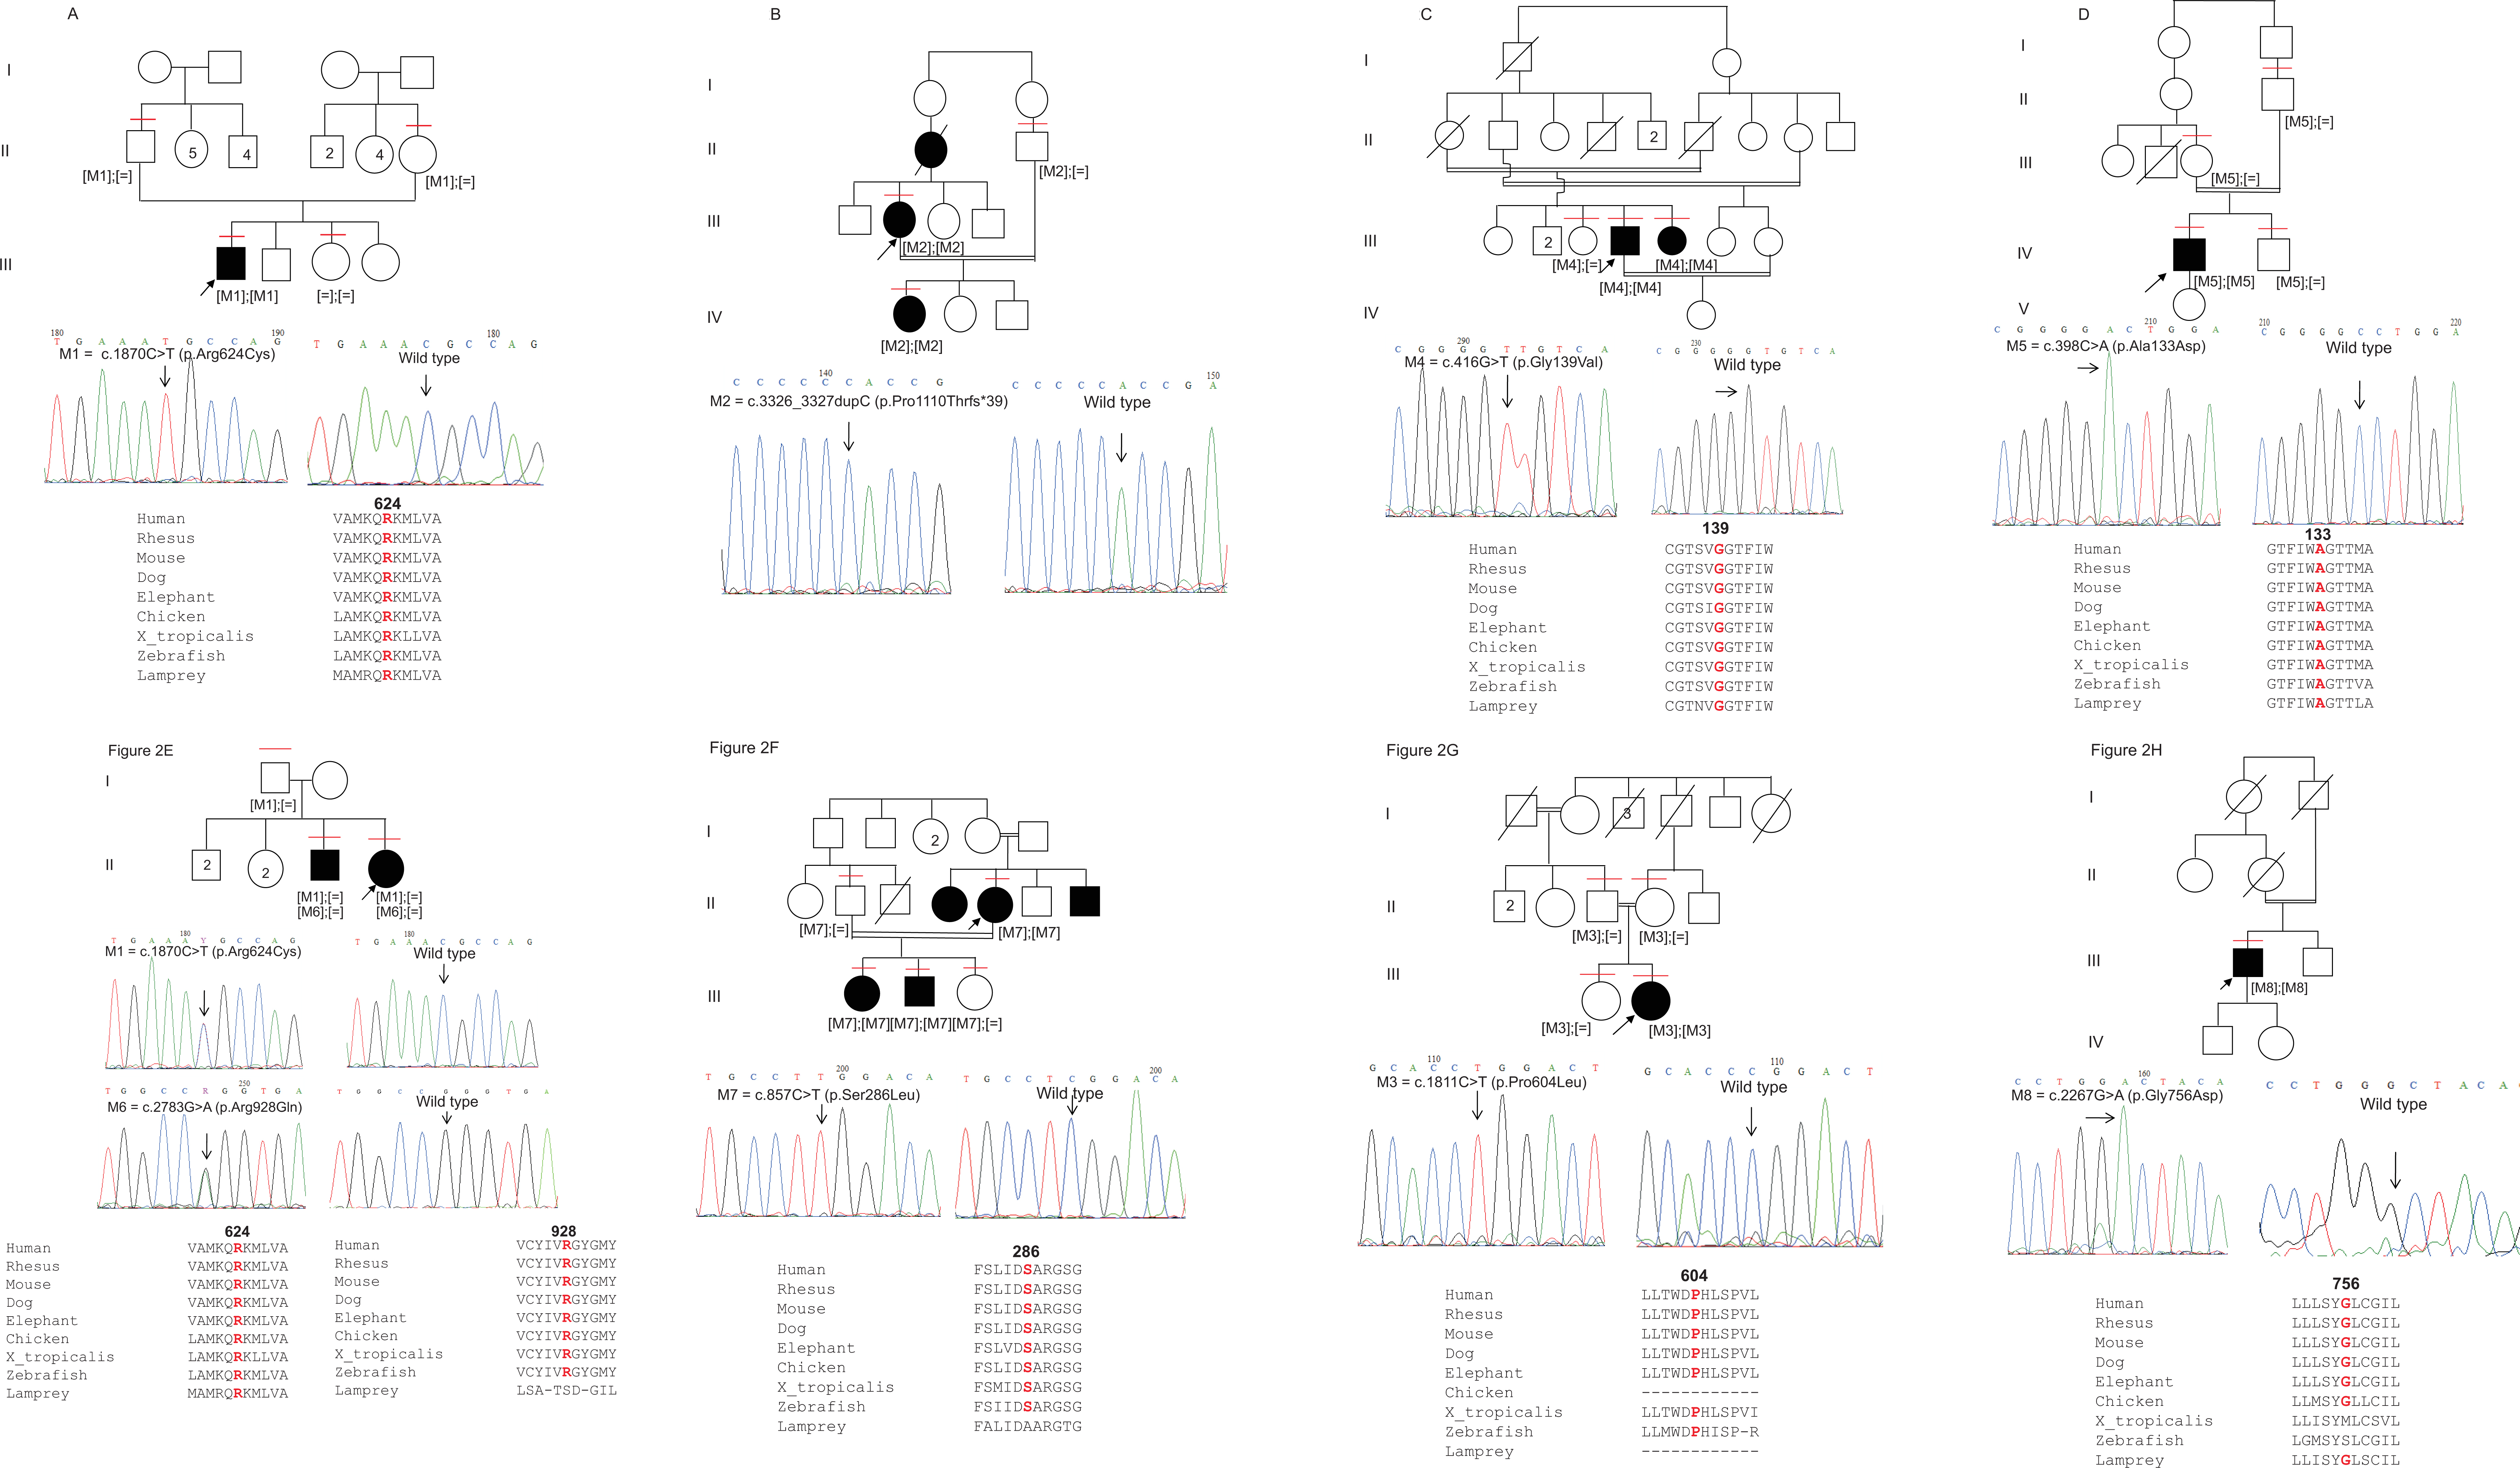
 Figure 2 of
Malaichamy, Mol Vis 2014; 20:341-351.
Figure 2 of
Malaichamy, Mol Vis 2014; 20:341-351.