Figure 1. Electroretinogram traces. Full-field electroretinogram (ERG) trace of a normal, TRPM1, GRM6, and GRP179 mutation-positive patient, respectively. The waveform of single flash rod response, combined rod-cone response, oscillatory
potentials, single flash cone response, and response to 30-Hz flicker are represented.
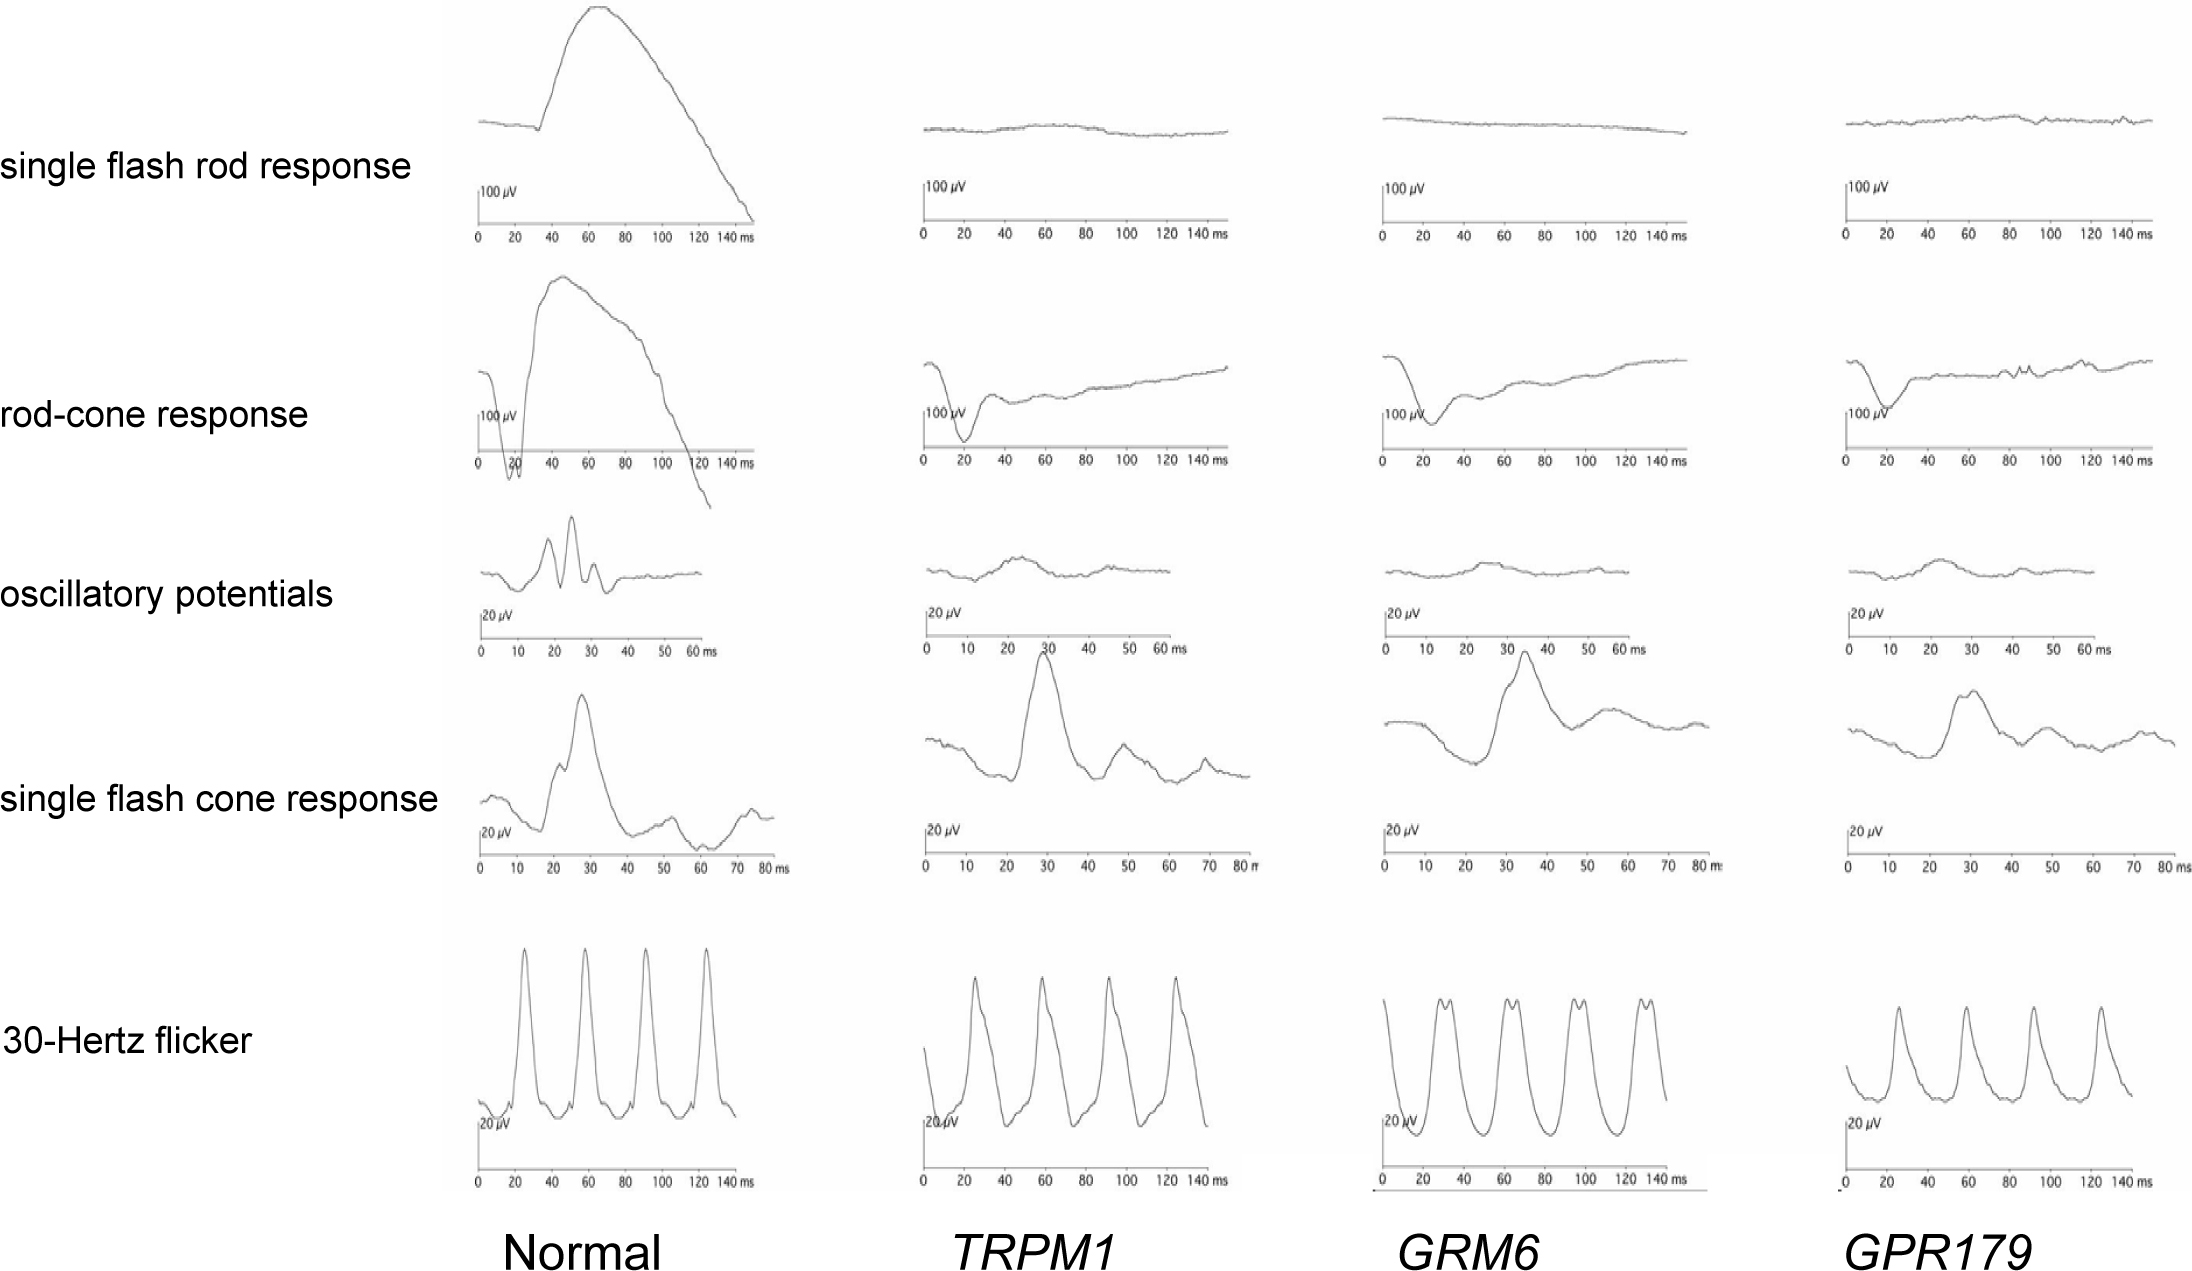
 Figure 1 of
Malaichamy, Mol Vis 2014; 20:341-351.
Figure 1 of
Malaichamy, Mol Vis 2014; 20:341-351.