Figure 7. Expression of selected genes in the retinas of EpoR knockdown mice. A, B: Relative quantification of erythropoietin (Epo), erythropoietin receptor (EpoR), soluble erythropoietin receptor (sEpoR), beta common receptor (Csf2rb (βCR)), B cell lymphoma 2 (Bcl2), Bcl2-like 1 (Bcl2l1(BclXL)), apoptotic protease activating factor 1 (Apaf1), brain-derived neurotrophic factor (Bdnf), caspase 1 (Casp1), and glial fibrillary acidic protein (Gfap) gene expression in the retinas of the EpoRflox/flox;Opn-Cre (A) and the EpoRflox/flox;α-Cre mice (B) compared to EpoRflox/flox control littermates with real-time PCR. cDNAs were prepared from total retinal RNA isolated at P84. Animals were kept under
normoxic conditions (N) or exposed to hypoxia (H, 7% O2, 6 h) immediately before euthanasia and retina isolation. Given are the mean ± standard deviation (SD) for n = 4 retinas.
Values were normalized to actin beta (Actb) and expressed relative to the EpoRflox/flox control littermates under normoxic conditions, which were set to 1. The differences in gene expression levels between the
knockdown and control mice at individual time points and conditions were tested for significance using a Student t test *: p<0.05; **: p<0.01; ***: p<0.001.
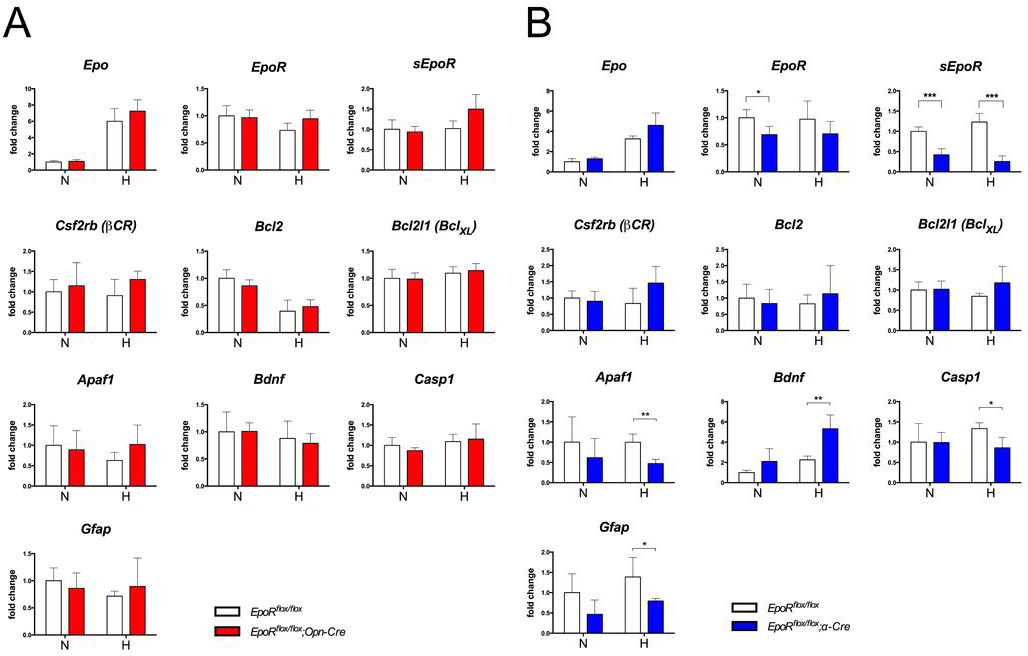
 Figure 7 of
Caprara, Mol Vis 2014; 20:307-324.
Figure 7 of
Caprara, Mol Vis 2014; 20:307-324.