Figure 6. Retinal morphology of EpoR knockdown mice exposed to hypoxia. A: Retinal morphology of the EpoRflox/flox, EpoRflox/flox;Opn-Cre, and EpoRflox/flox;α-Cre mice analyzed 12 days after they were exposed to hypoxia (7% O2, 6 h). Shown are representative sections of the central retina (EpoRflox/flox and EpoRflox/flox;Opn-Cre mice) or the peripheral retina (EpoRflox/flox;α-Cre mice) of three animals per time point. Scale bar: 50 µm. B: Thickness of the retinas of the EpoRflox/flox (black line), EpoRflox/flox;Opn-Cre, (red line), and EpoRflox/flox;α-Cre (blue line) mice. Thickness was measured 12 days after the mice were exposed to hypoxia (7% O2, 6 h) at 0, 100, 325, 650, 975, 1300, 1625, and 1950 μm from the optic nerve head (ONH) in the dorsal and ventral hemispheres,
as indicated. Shown are the mean ± standard deviation (SD); n = 3. The differences in retinal thickness between the knockdown
and control mice were tested for significance using a Student t test.
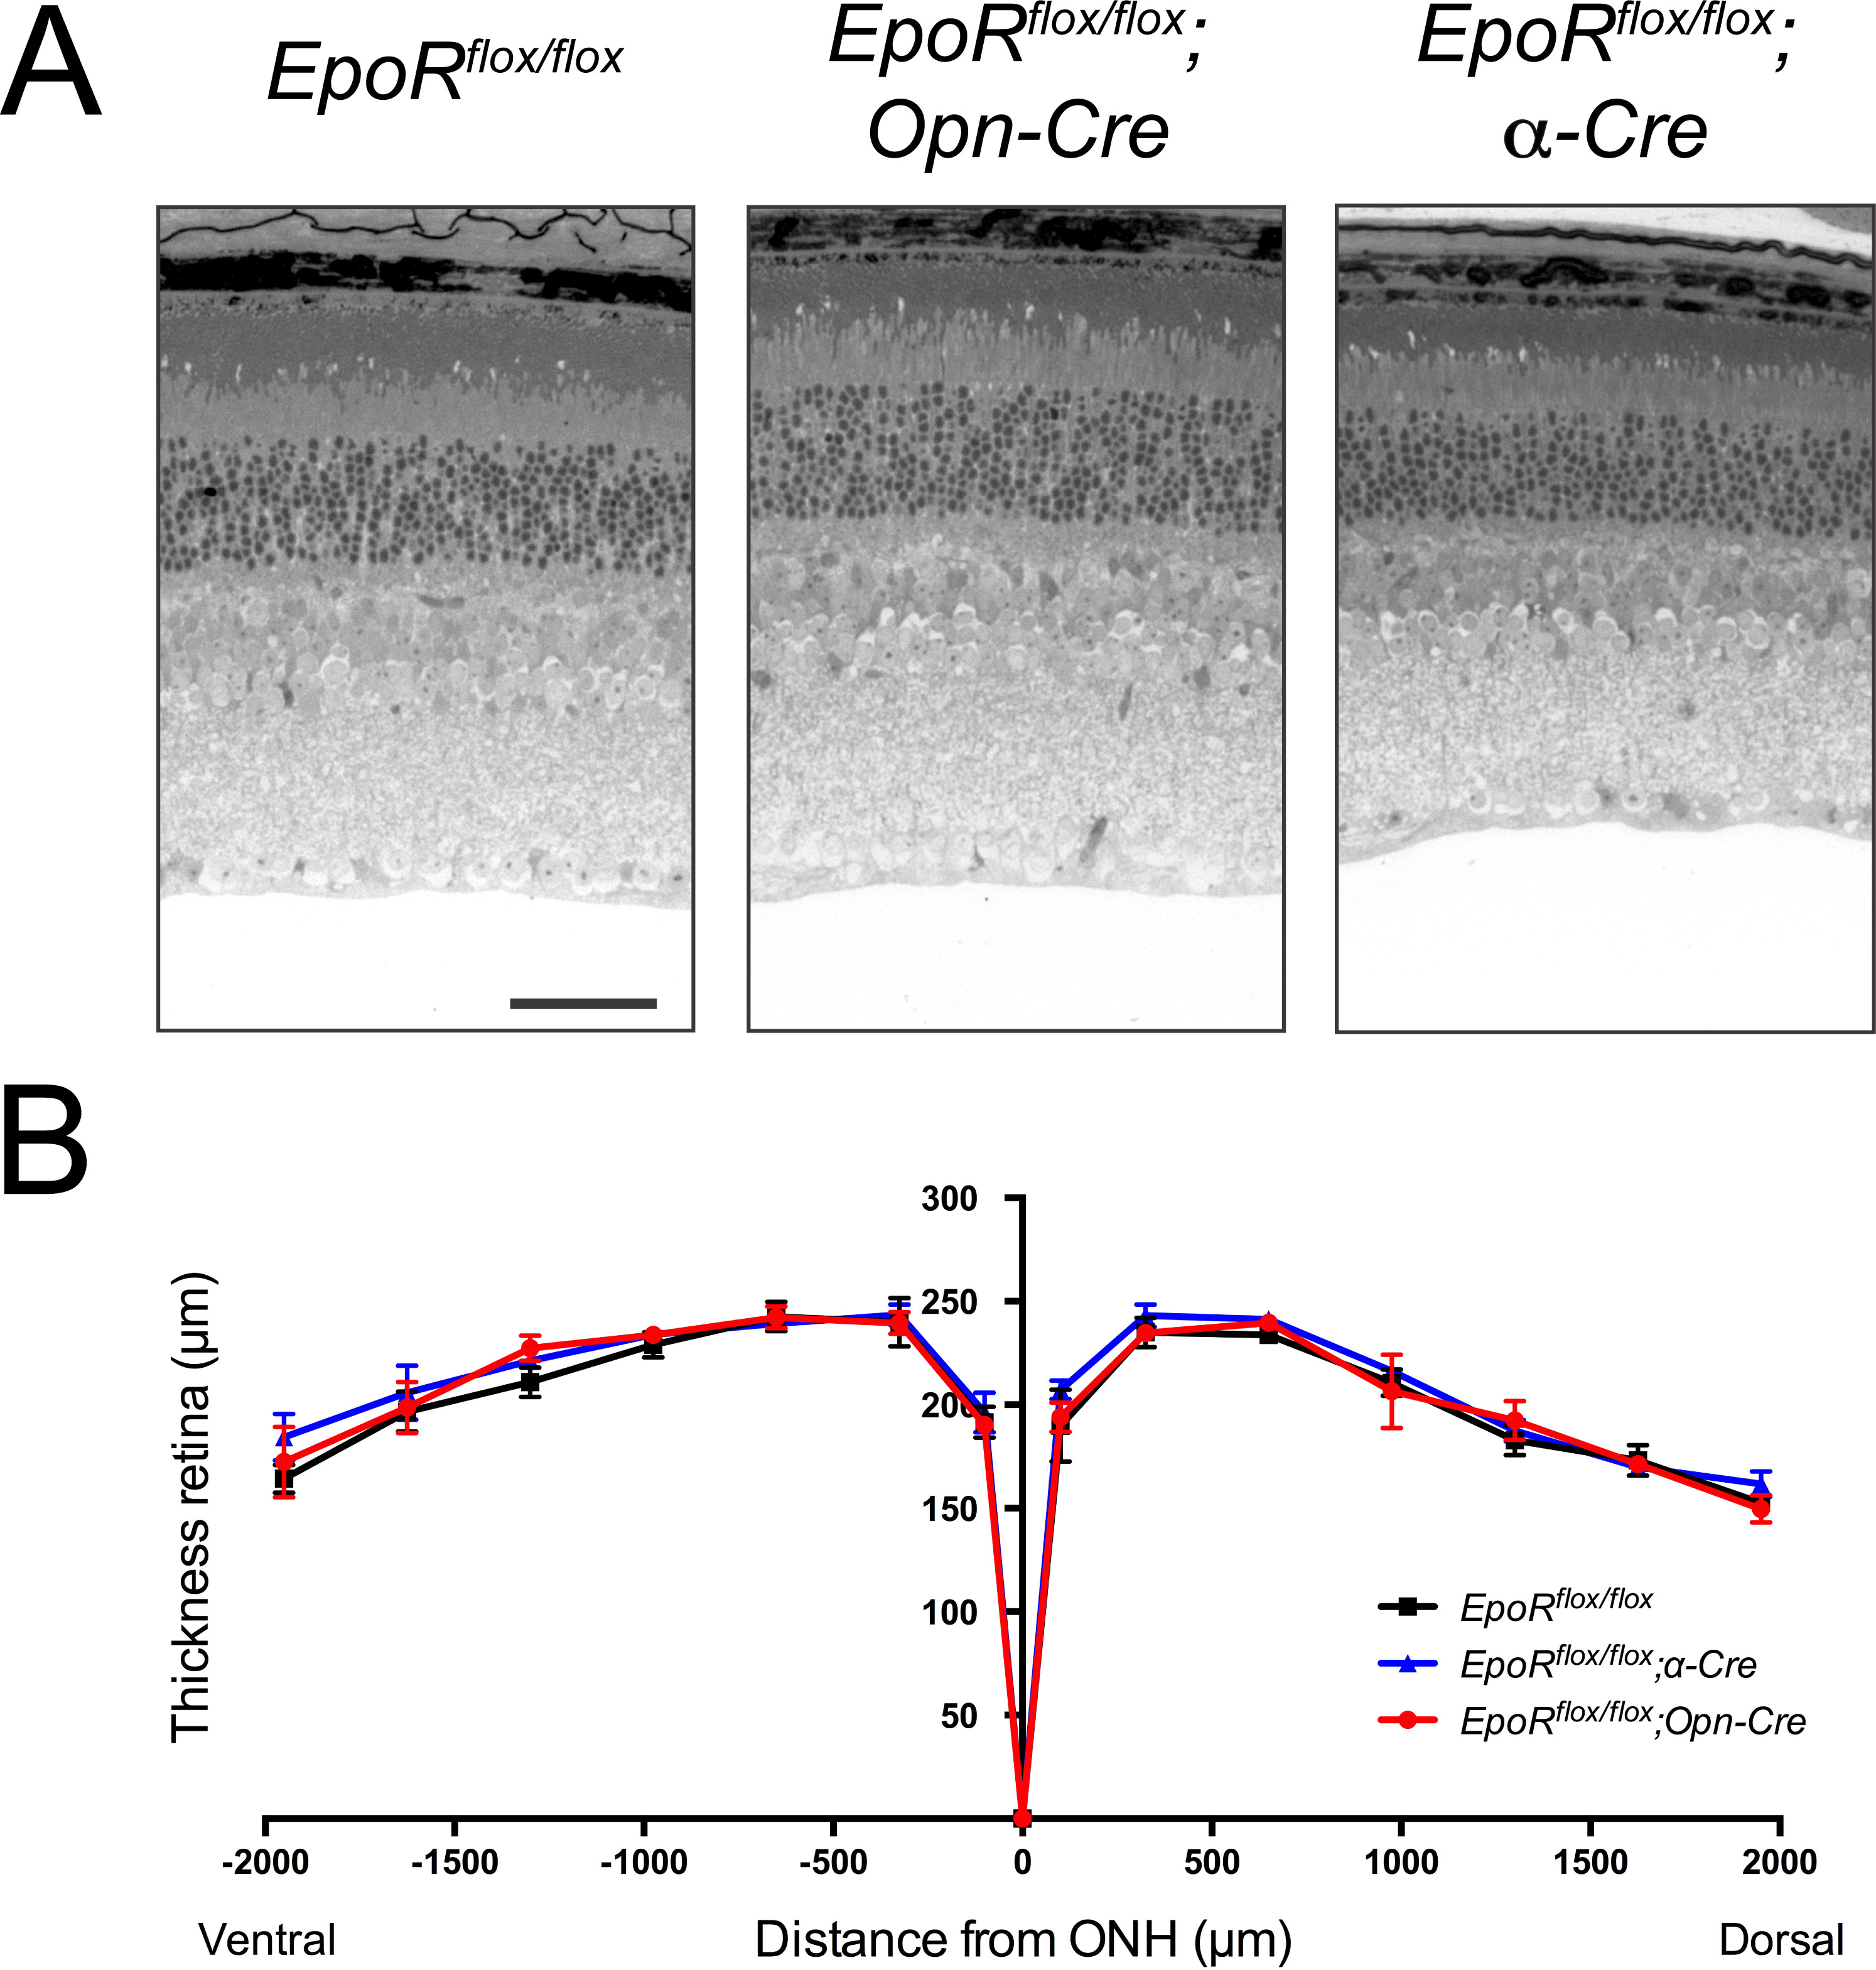
 Figure 6 of
Caprara, Mol Vis 2014; 20:307-324.
Figure 6 of
Caprara, Mol Vis 2014; 20:307-324.