Figure 5. Retinal function in EpoR knockdown mice. (A) Scotopic and (B) photopic electroretinogram (ERG) recordings in the EpoRflox/flox;Opn-Cre and EpoRflox/flox;α-Cre mice and the EpoRflox/flox control littermates. (C) Scotopic a-wave, (D) scotopic b-wave, and (E) photopic b-wave amplitudes plotted as a function of light intensity. Shown are the mean ± standard deviation (SD) of n =
3 animals per genotype.
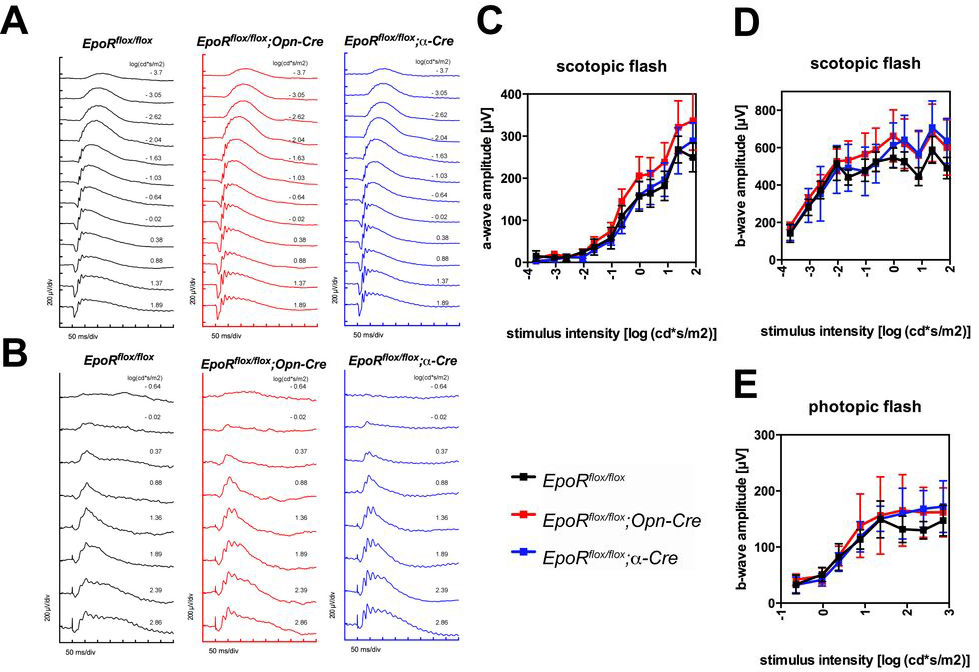
 Figure 5 of
Caprara, Mol Vis 2014; 20:307-324.
Figure 5 of
Caprara, Mol Vis 2014; 20:307-324.