Figure 4. Retinal morphology of EpoR knockdown mice. A: Retinal morphology of the EpoRflox/flox, EpoRflox/flox;Opn-Cre and EpoRflox/flox;α-Cre mice at P84 and P360. Shown are representative sections of the central retina (EpoRflox/flox and EpoRflox/flox;Opn-Cre) and the peripheral retina (EpoRflox/flox;α-Cre) of at least three animals per time point. Scale bar: 50 µm. B, C: Relative expression levels of rhodopsin (Rho), guanine nucleotide binding protein alpha transducin 2 (Gnat2), visual system homeobox 2 (Vsx2 (Chx10)), and POU domain, class 4 transcription factor 1 (Pou4f1 (Brn3a)) mRNAs as determined with semiquantitative real-time PCR in the total retinas of the EpoRflox/flox;Opn-Cre (B, red bars), EpoRflox/flox;α-Cre (C, blue bars), and EpoRflox/flox control littermates (B, C, white bars) at 7.5 months of age. Given are the mean ± standard deviation (SD) of n = 4 retinas. Values were normalized
to actin beta (Actb) and expressed relative to the EpoRflox/flox control littermates, in which expression was set to 1. The differences in gene expression levels between the knockdown and
control mice at individual time points were tested for significance using a Student t test. D: Retinal thickness of 7.5-month-old EpoRflox/flox;Opn-Cre mice (red line), EpoRflox/flox;α-Cre mice (blue line), and EpoRflox/flox mice (black line). Thickness was measured at 0, 100, 325, 650, 975, 1300, 1625, and 1950 μm from the optic nerve head (ONH)
in the dorsal and ventral hemispheres, as indicated. Shown are the mean ± SD of n = 3 animals. The differences in retinal
thickness between the knockdown and control mice were tested for significance using a Student t test.
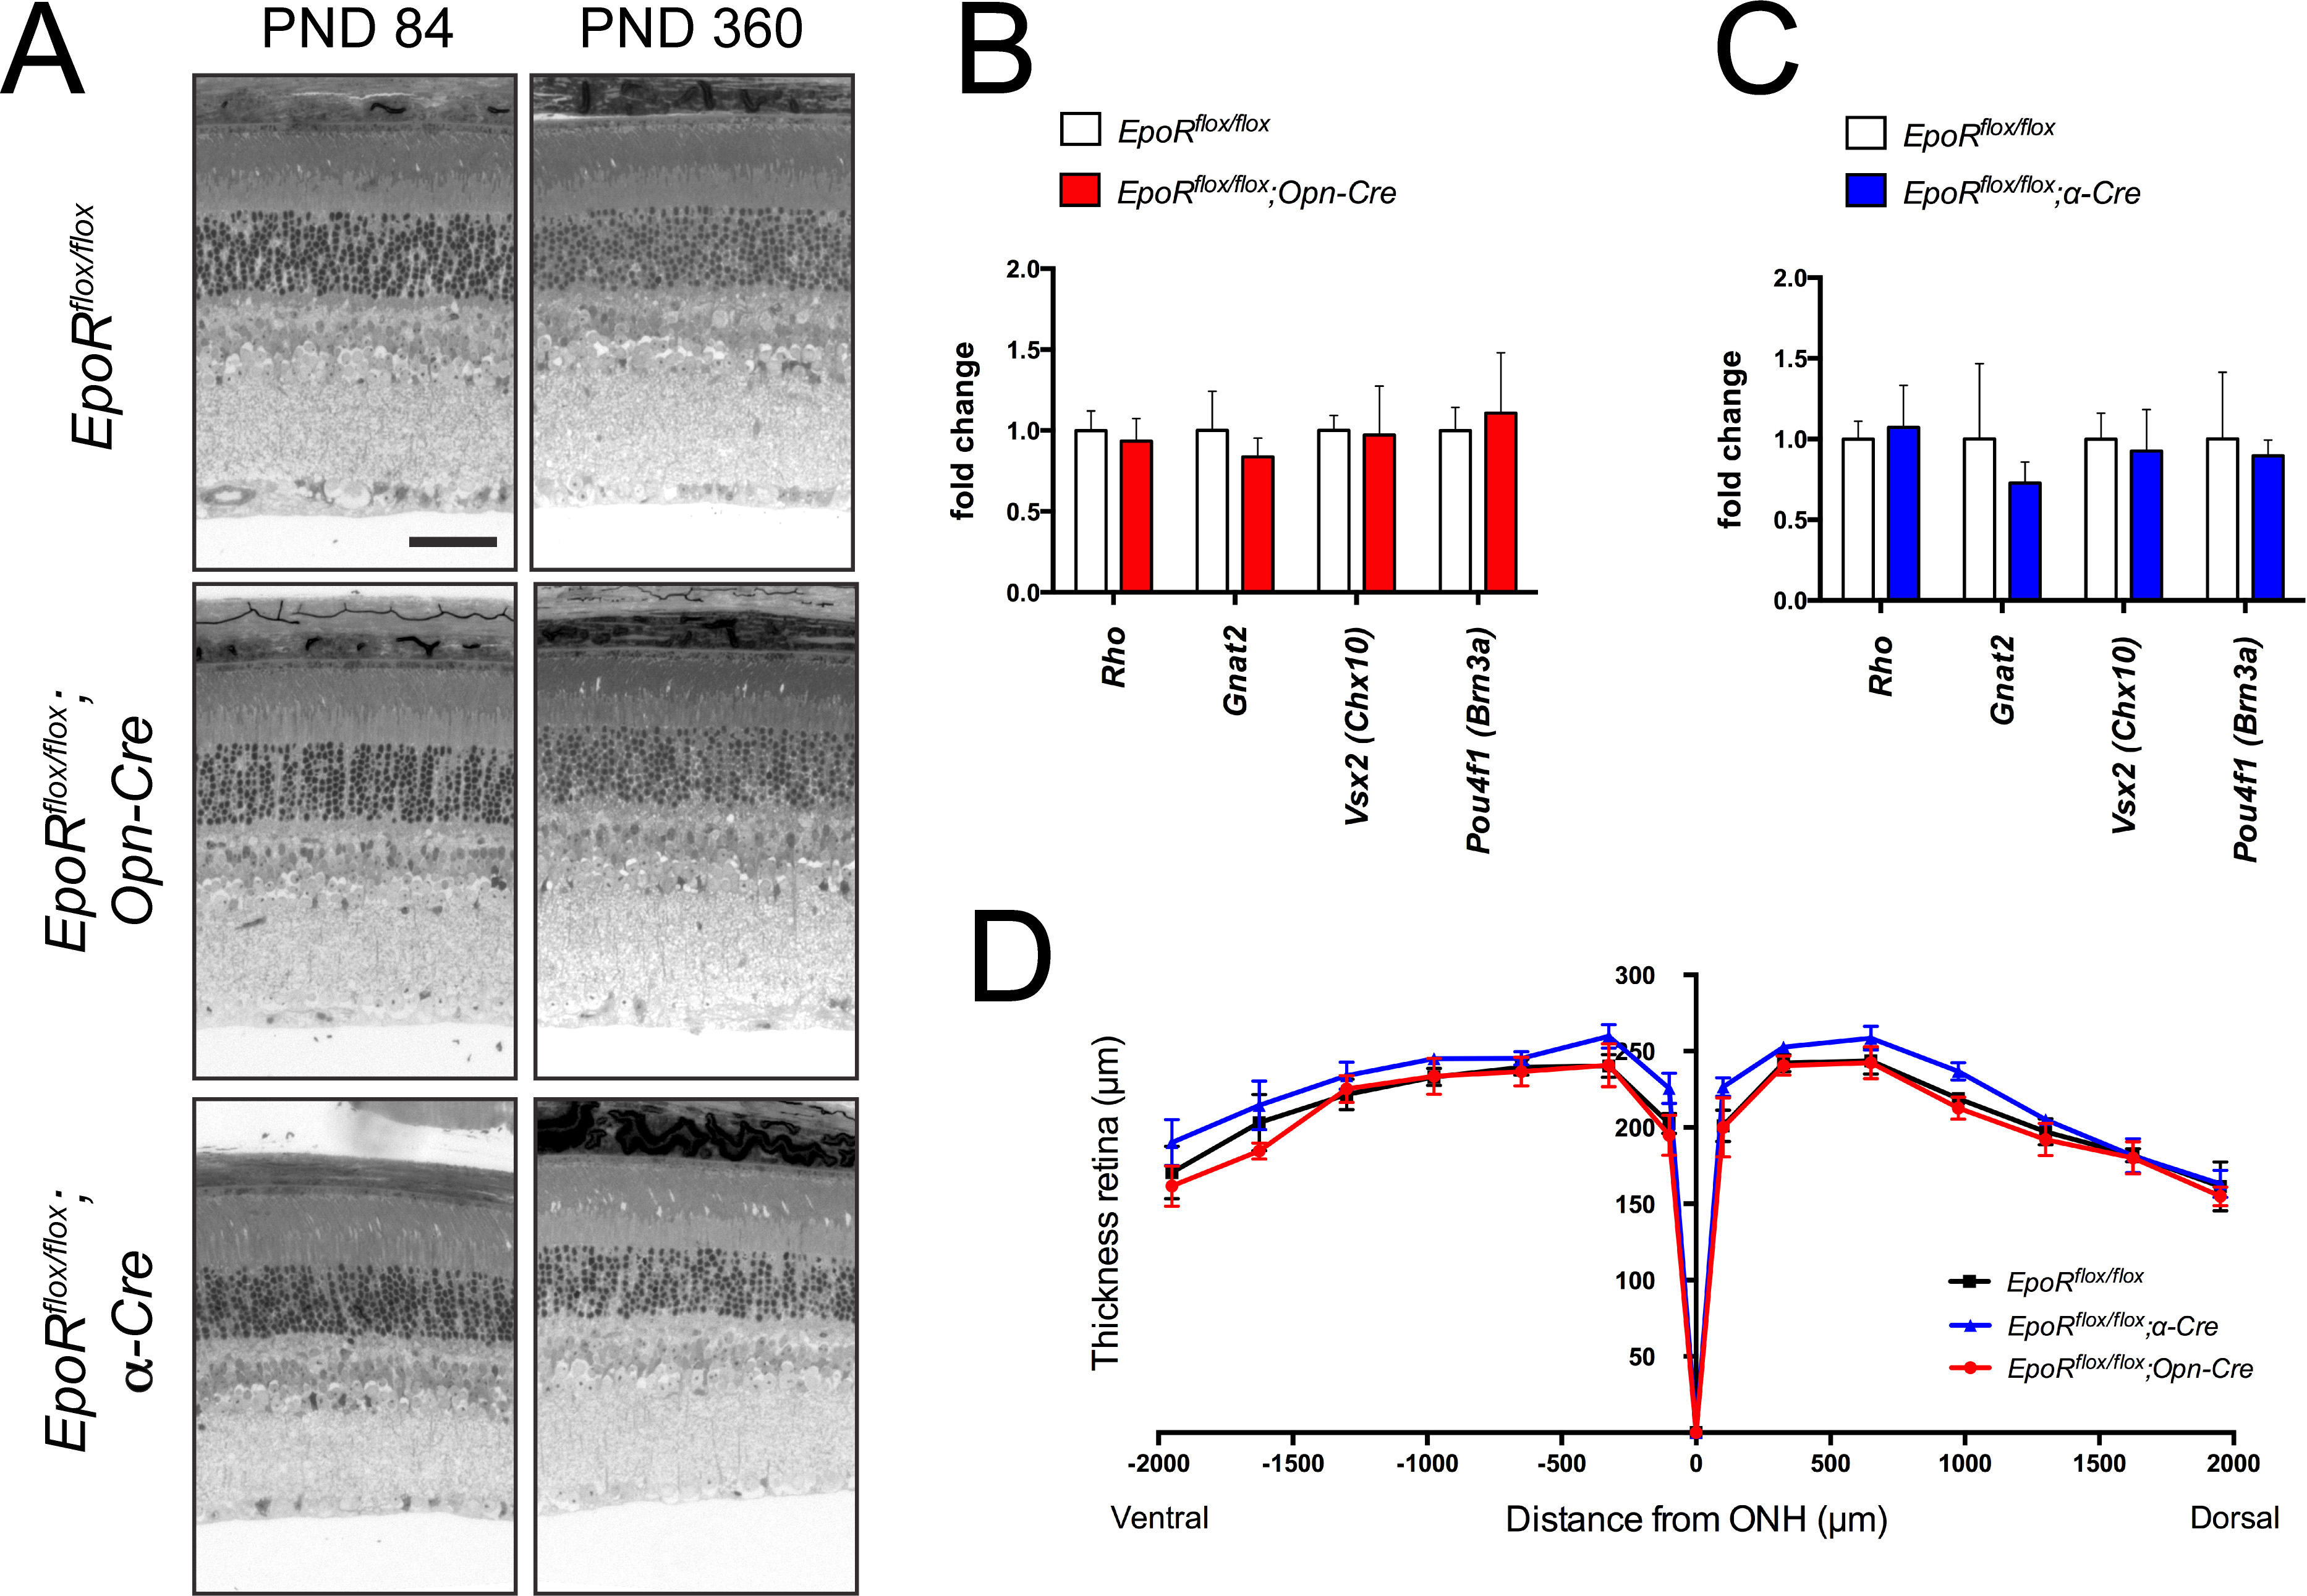
 Figure 4 of
Caprara, Mol Vis 2014; 20:307-324.
Figure 4 of
Caprara, Mol Vis 2014; 20:307-324.