Figure 3. Knockdown of EpoR in the EpoRflox/flox;Opn-Cre and EpoRflox/flox;α-Cre retinas. A: PCR amplification of genomic DNA isolated from the retinas of EpoRflox/flox, EpoRflox/flox;Opn-Cre, and EpoRflox/flox; α-Cre mice at P84 (n = 3). CRE-mediated recombination resulted in the amplification of a 220 bp fragment. B: Semiquantitative real-time PCR analysis of the expression of EpoR in total retinal RNA from the EpoRflox/flox;α-Cre mice (blue bar) and the EpoRflox/flox mice (white bar) at P84. Values were normalized to actin beta (Actb), and the EpoRflox/flox values were set to 1. Shown are the mean ± standard deviation (SD) of n = 4 animals. C: Semiquantitative real-time PCR analysis of EpoR levels in different retinal layers separated by laser capture microdissection from the EpoRflox/flox (white bars) and EpoRflox/flox;Opn-Cre mice (red bars). Values were normalized to actin beta (Actb) and expressed relative to the value of EpoRflox/flox mice for each layer, which were set to 1. Shown are the mean ± SD of at least two mice. ONL, outer nuclear layer; INL, inner
nuclear layer; GCL, ganglion cell layer. The differences in gene expression levels between the knockdown and control mice
were tested for significance using a Student t test. *: p<0.05.
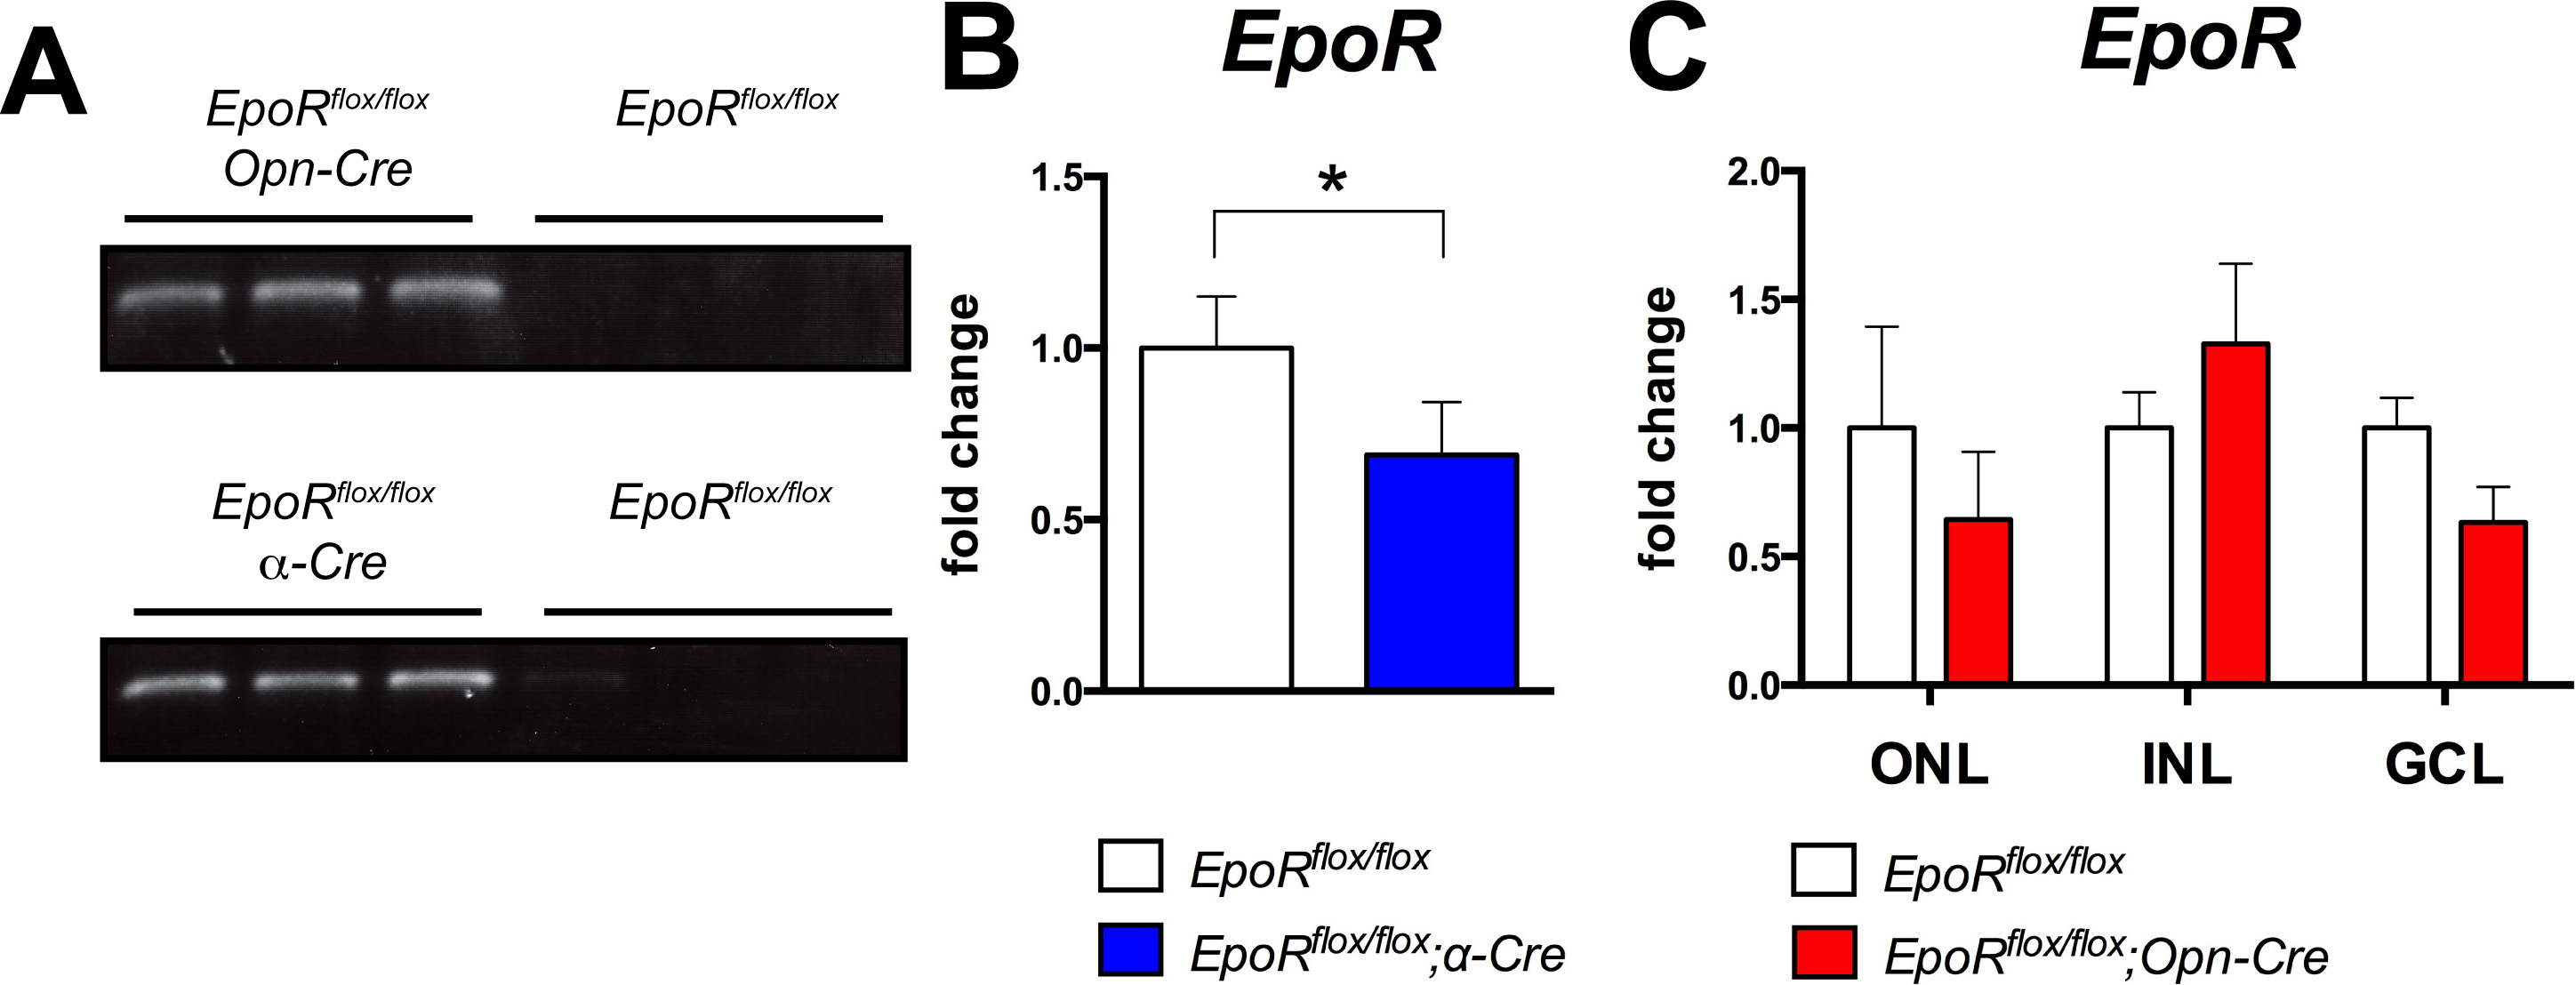
 Figure 3 of
Caprara, Mol Vis 2014; 20:307-324.
Figure 3 of
Caprara, Mol Vis 2014; 20:307-324.