Figure 2. Expression of EpoR in the retinal nuclear layers. Semiquantitative real-time PCR after laser capture microdissection showed relative EpoR mRNA levels in the different retinal layers (as indicated) of the EpoRflox/flox control mice. Values were normalized to actin beta (Actb) and expressed relative to the value in the ONL, which was set to 1. Shown are the mean ± standard deviation (SD) of at least
two mice amplified in duplicate. ONL, outer nuclear layer; INL, inner nuclear layer; GCL, ganglion cell layer.
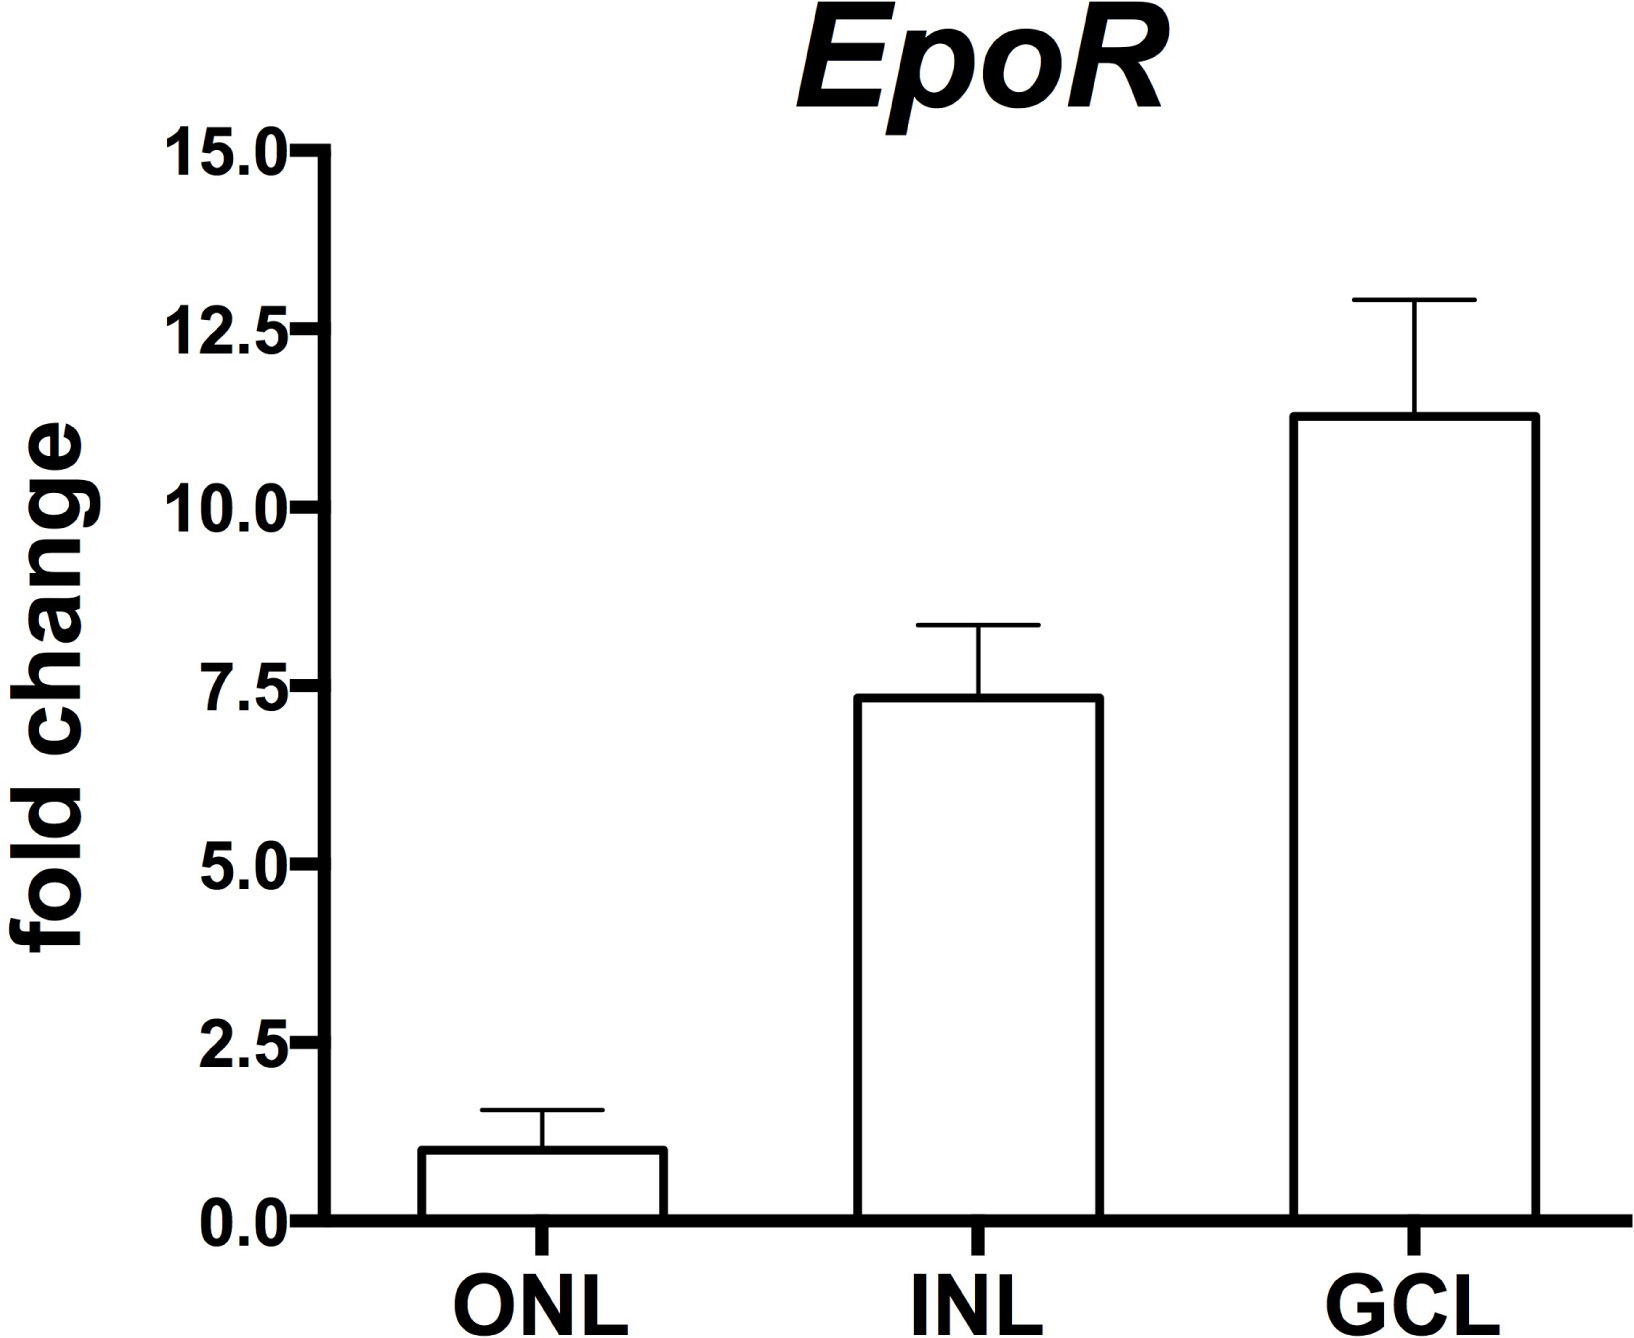
 Figure 2 of
Caprara, Mol Vis 2014; 20:307-324.
Figure 2 of
Caprara, Mol Vis 2014; 20:307-324.