Figure 1. Gene expression profile in the retinas of wild-type mice. Relative expression of erythropoietin (Epo; A), erythropoietin receptor (EpoR; B), soluble erythropoietin receptor (sEpoR; C), and beta common receptor (Csf2rb (βCR); D) as measured with semiquantitative real-time PCR on cDNA samples prepared from the total retinas of the C57BL/6 mice at the
postnatal days as indicated. All values were normalized to actin beta (Actb), and the value at P3 was set to 1. Shown are the mean ± standard deviation (SD) of n = 3 animals.
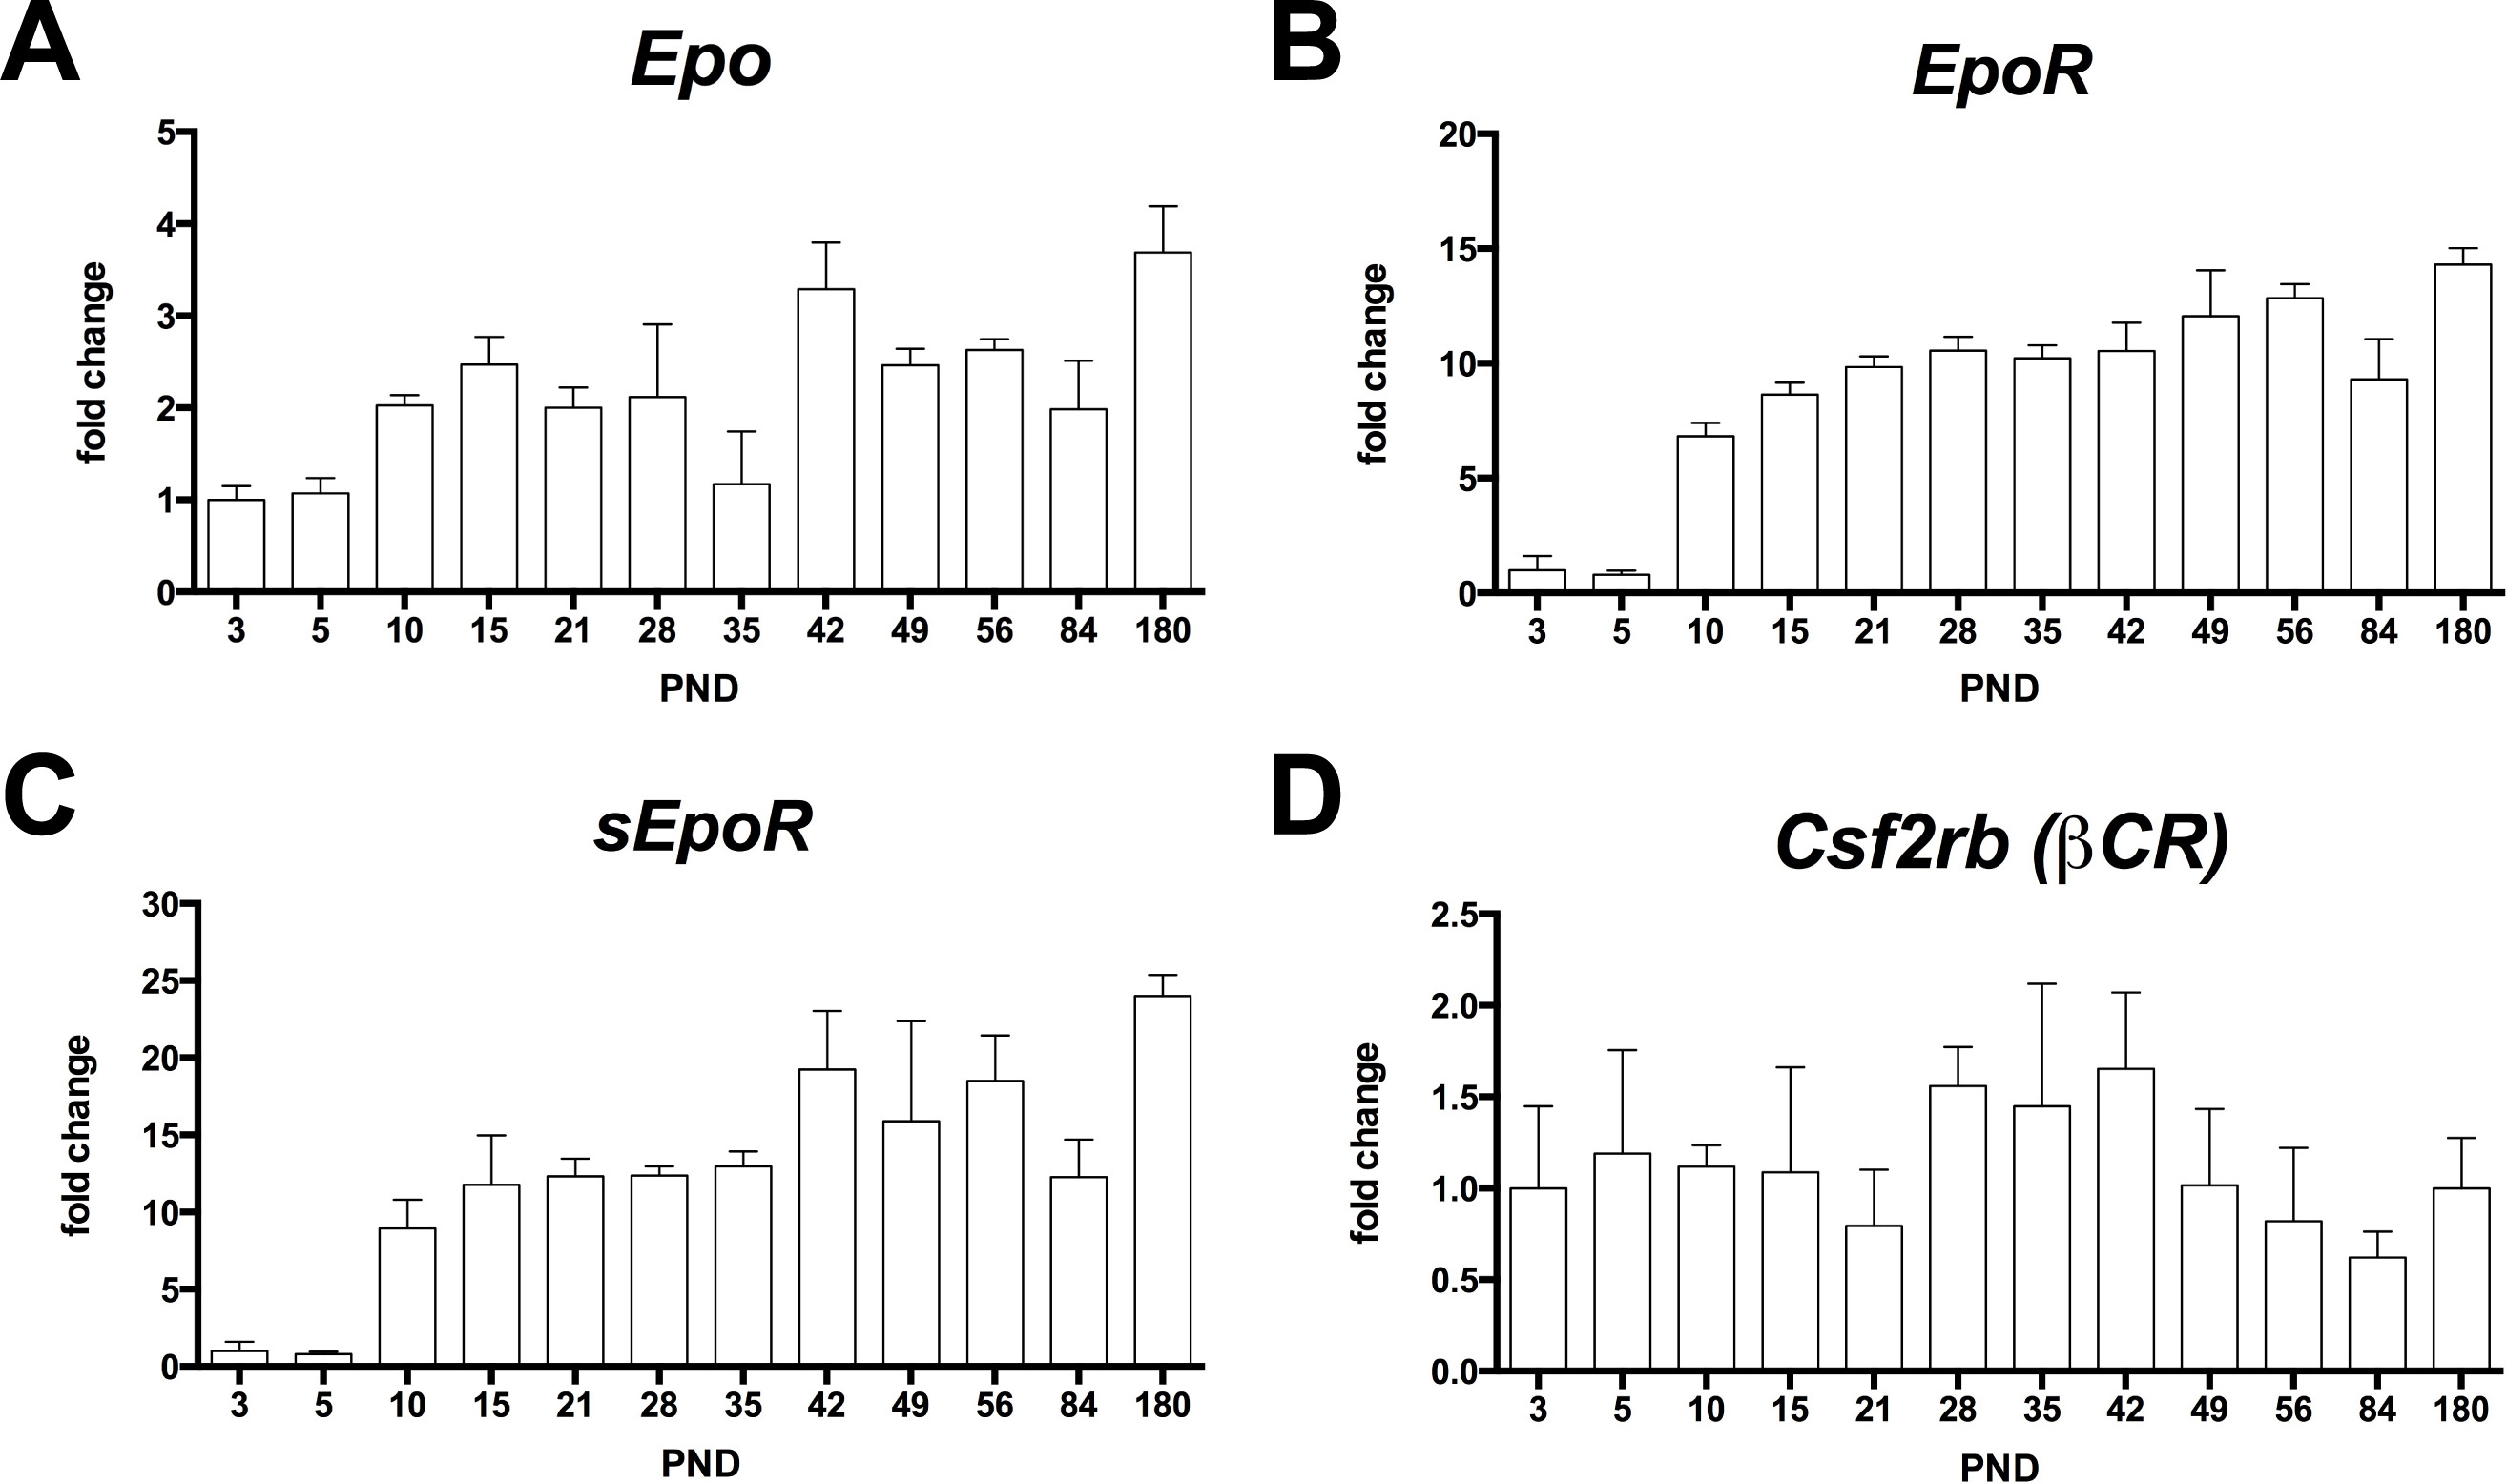
 Figure 1 of
Caprara, Mol Vis 2014; 20:307-324.
Figure 1 of
Caprara, Mol Vis 2014; 20:307-324.