Figure 1. Accumulation of A2E in ARPE-19 cells. A: Reverse phase high-performance liquid chromatography (HPLC) of A2E: from top to bottom, A2E standard, extracts of cells
multiple-fed 100 nM, 1 µM, and 10 µM A2E, respectively, delivered in dimethyl sulfoxide (DMSO). The absorption spectra (250
to 550 nm) of the A2E peak (10.4–10.9 min) are shown (insets) for the standard and 1 µM and 10 µM chromatogram. An absorption
spectrum (250–520 nm) of the furan-A2E peak (7.9 min) is also shown. Dotted lines indicate the peaks whose spectra were scanned.
B: Reverse phase HPLC of A2E: from top to bottom, A2E standard, extracts of cells single-fed 100 nM, 1 µM, and 10 µM A2E, respectively,
delivered in DMSO. The absorption spectra (250 to 550 nm) of the A2E peak (10.4–10.9 min) are shown (insets) for the 1 µM
and 10 µM chromatograms. Dotted lines indicate the peaks whose spectra were scanned. Results shown are representative of two
separate experiments.
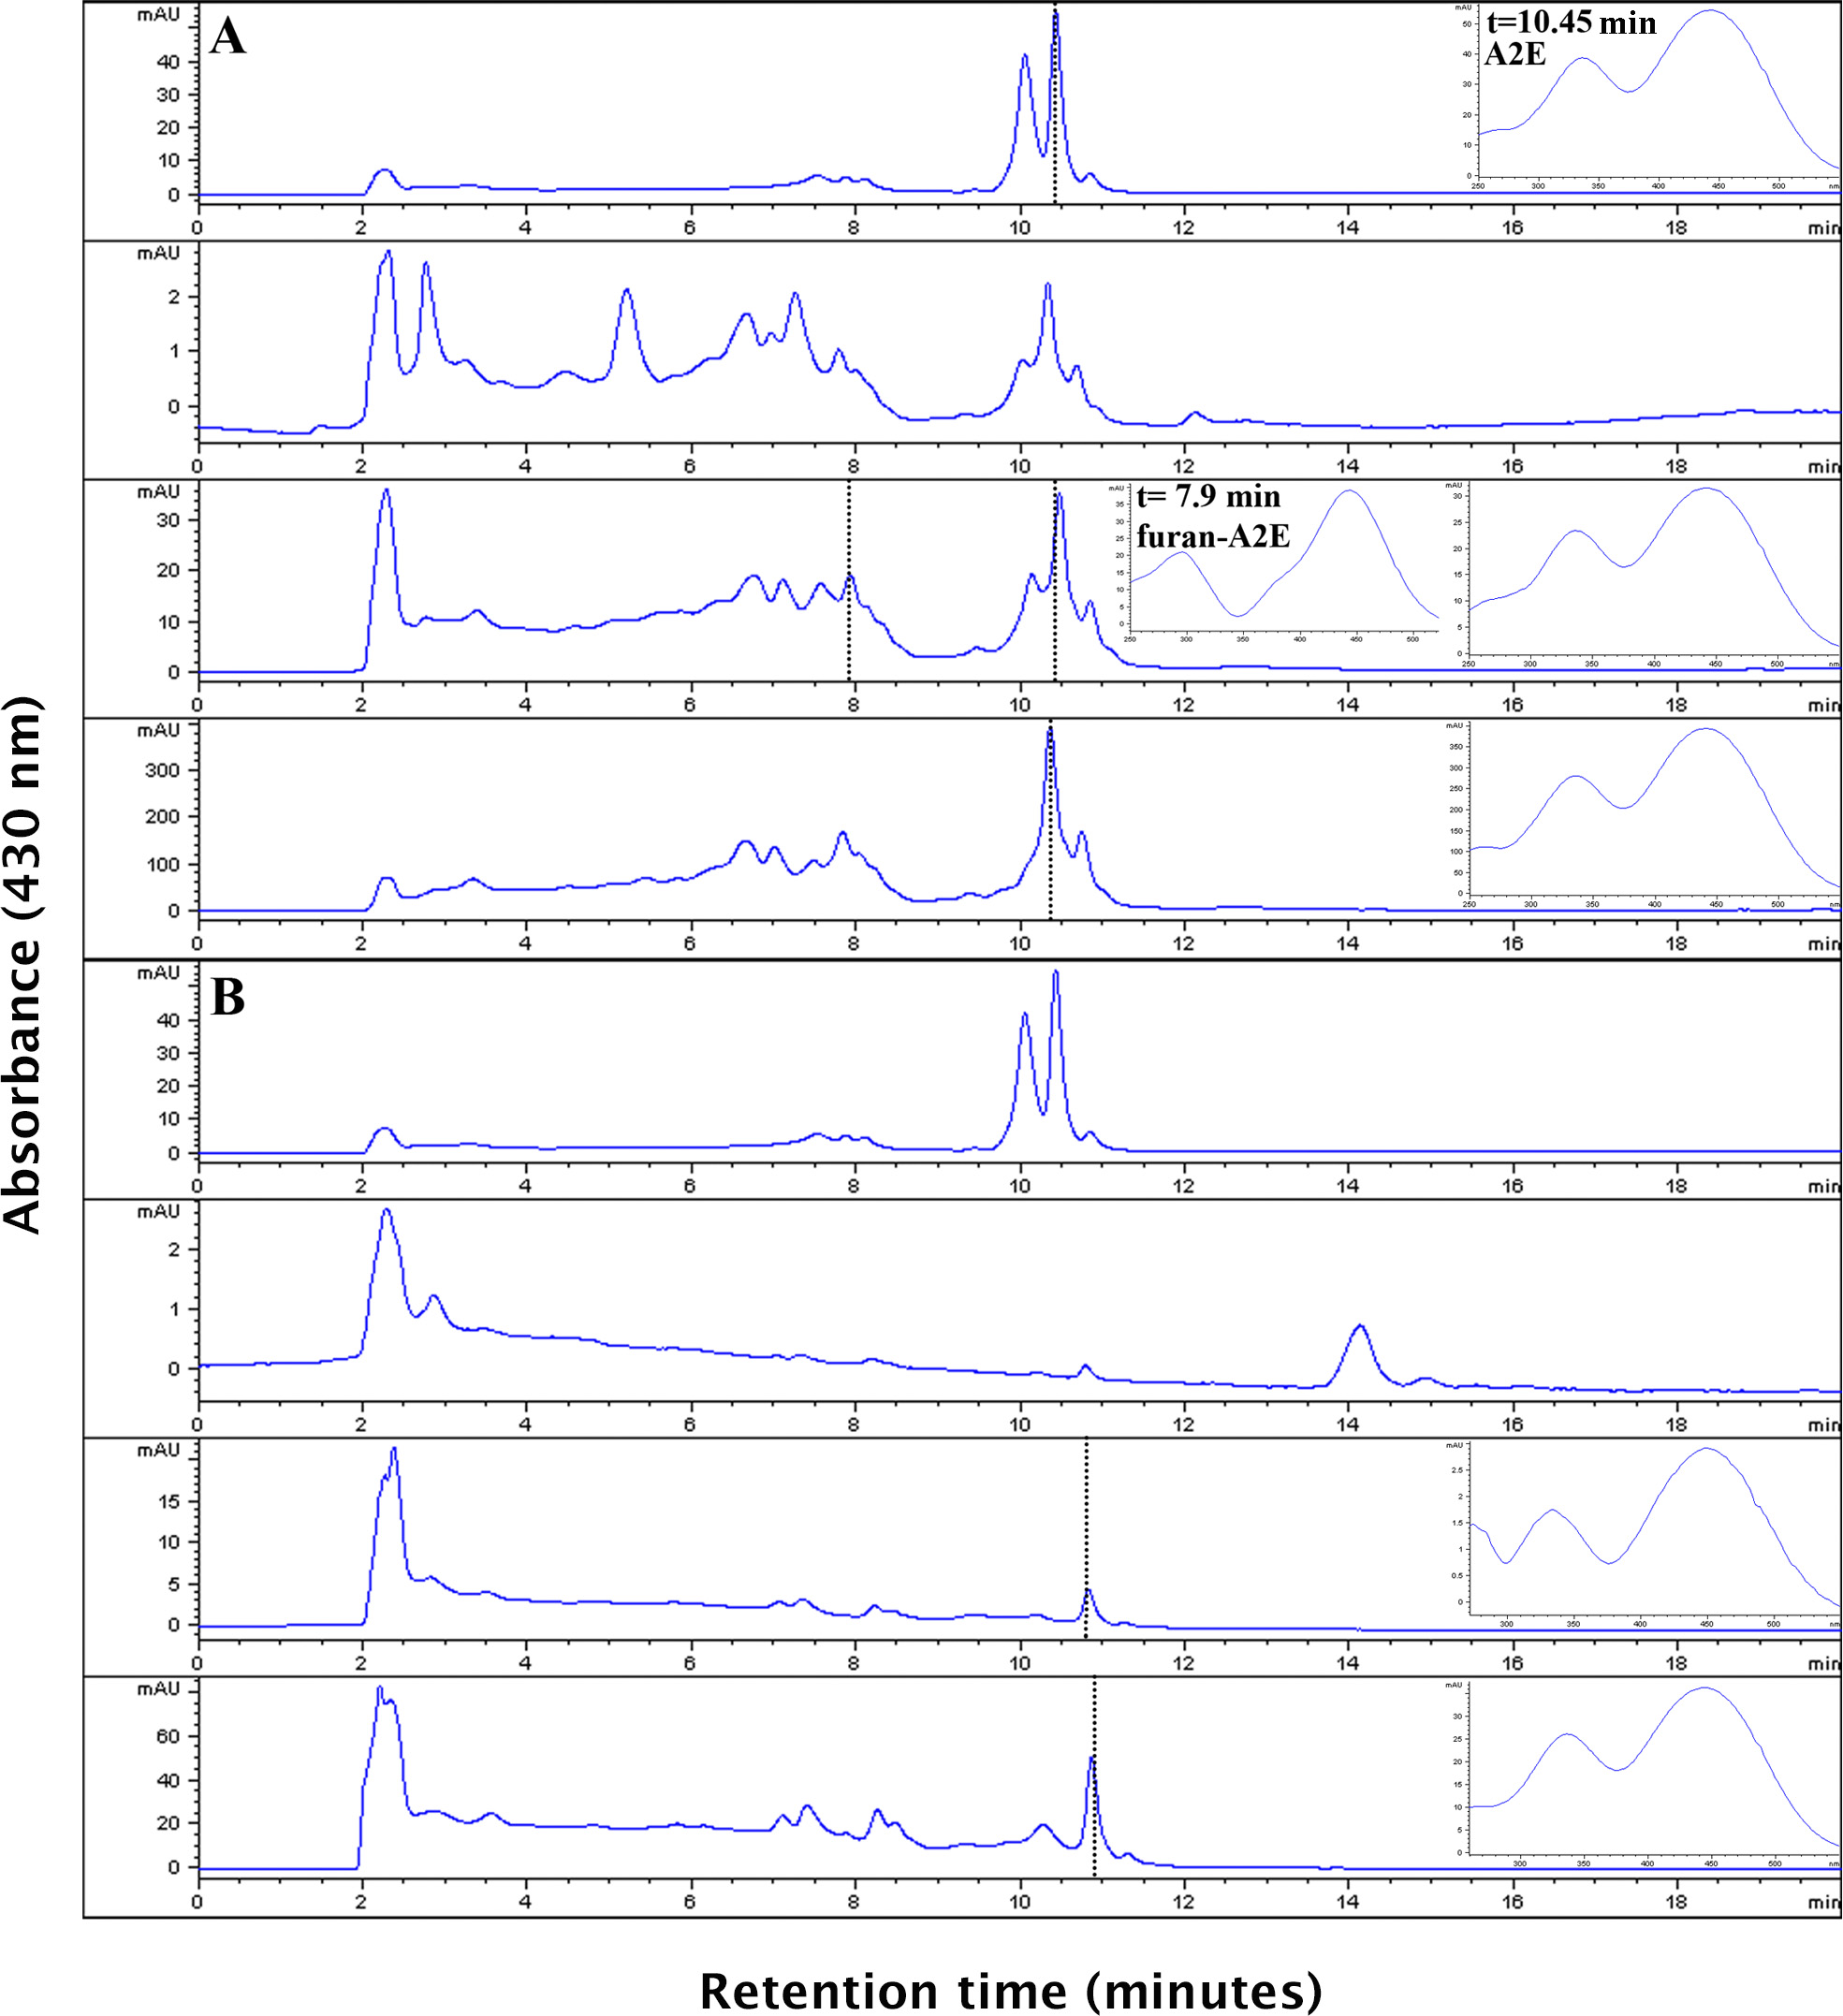
 Figure 1 of
Poliakov, Mol Vis 2014; 20:285-300.
Figure 1 of
Poliakov, Mol Vis 2014; 20:285-300.