Figure 5. Angiogenic factors expression. After the HRECs were treated with high glucose or high glucose plus different concentrations
of adrenomedullin22–52 for 8 h, RT–PCR analysis was performed to detect pro-angiogenic and anti-angiogenic factor gene expression in the HRECs.
A: Representative results from three independent runs of RT–PCR. B: Ratios of target gene expression to GAPDH were determined by RT–PCR. The quantitative data of the ratios were from three
independent experiments. All values represent Mean±SD (n=3). * p<0.05 versus the 30 mM group. # p<0.05 versus the 5 mM group.
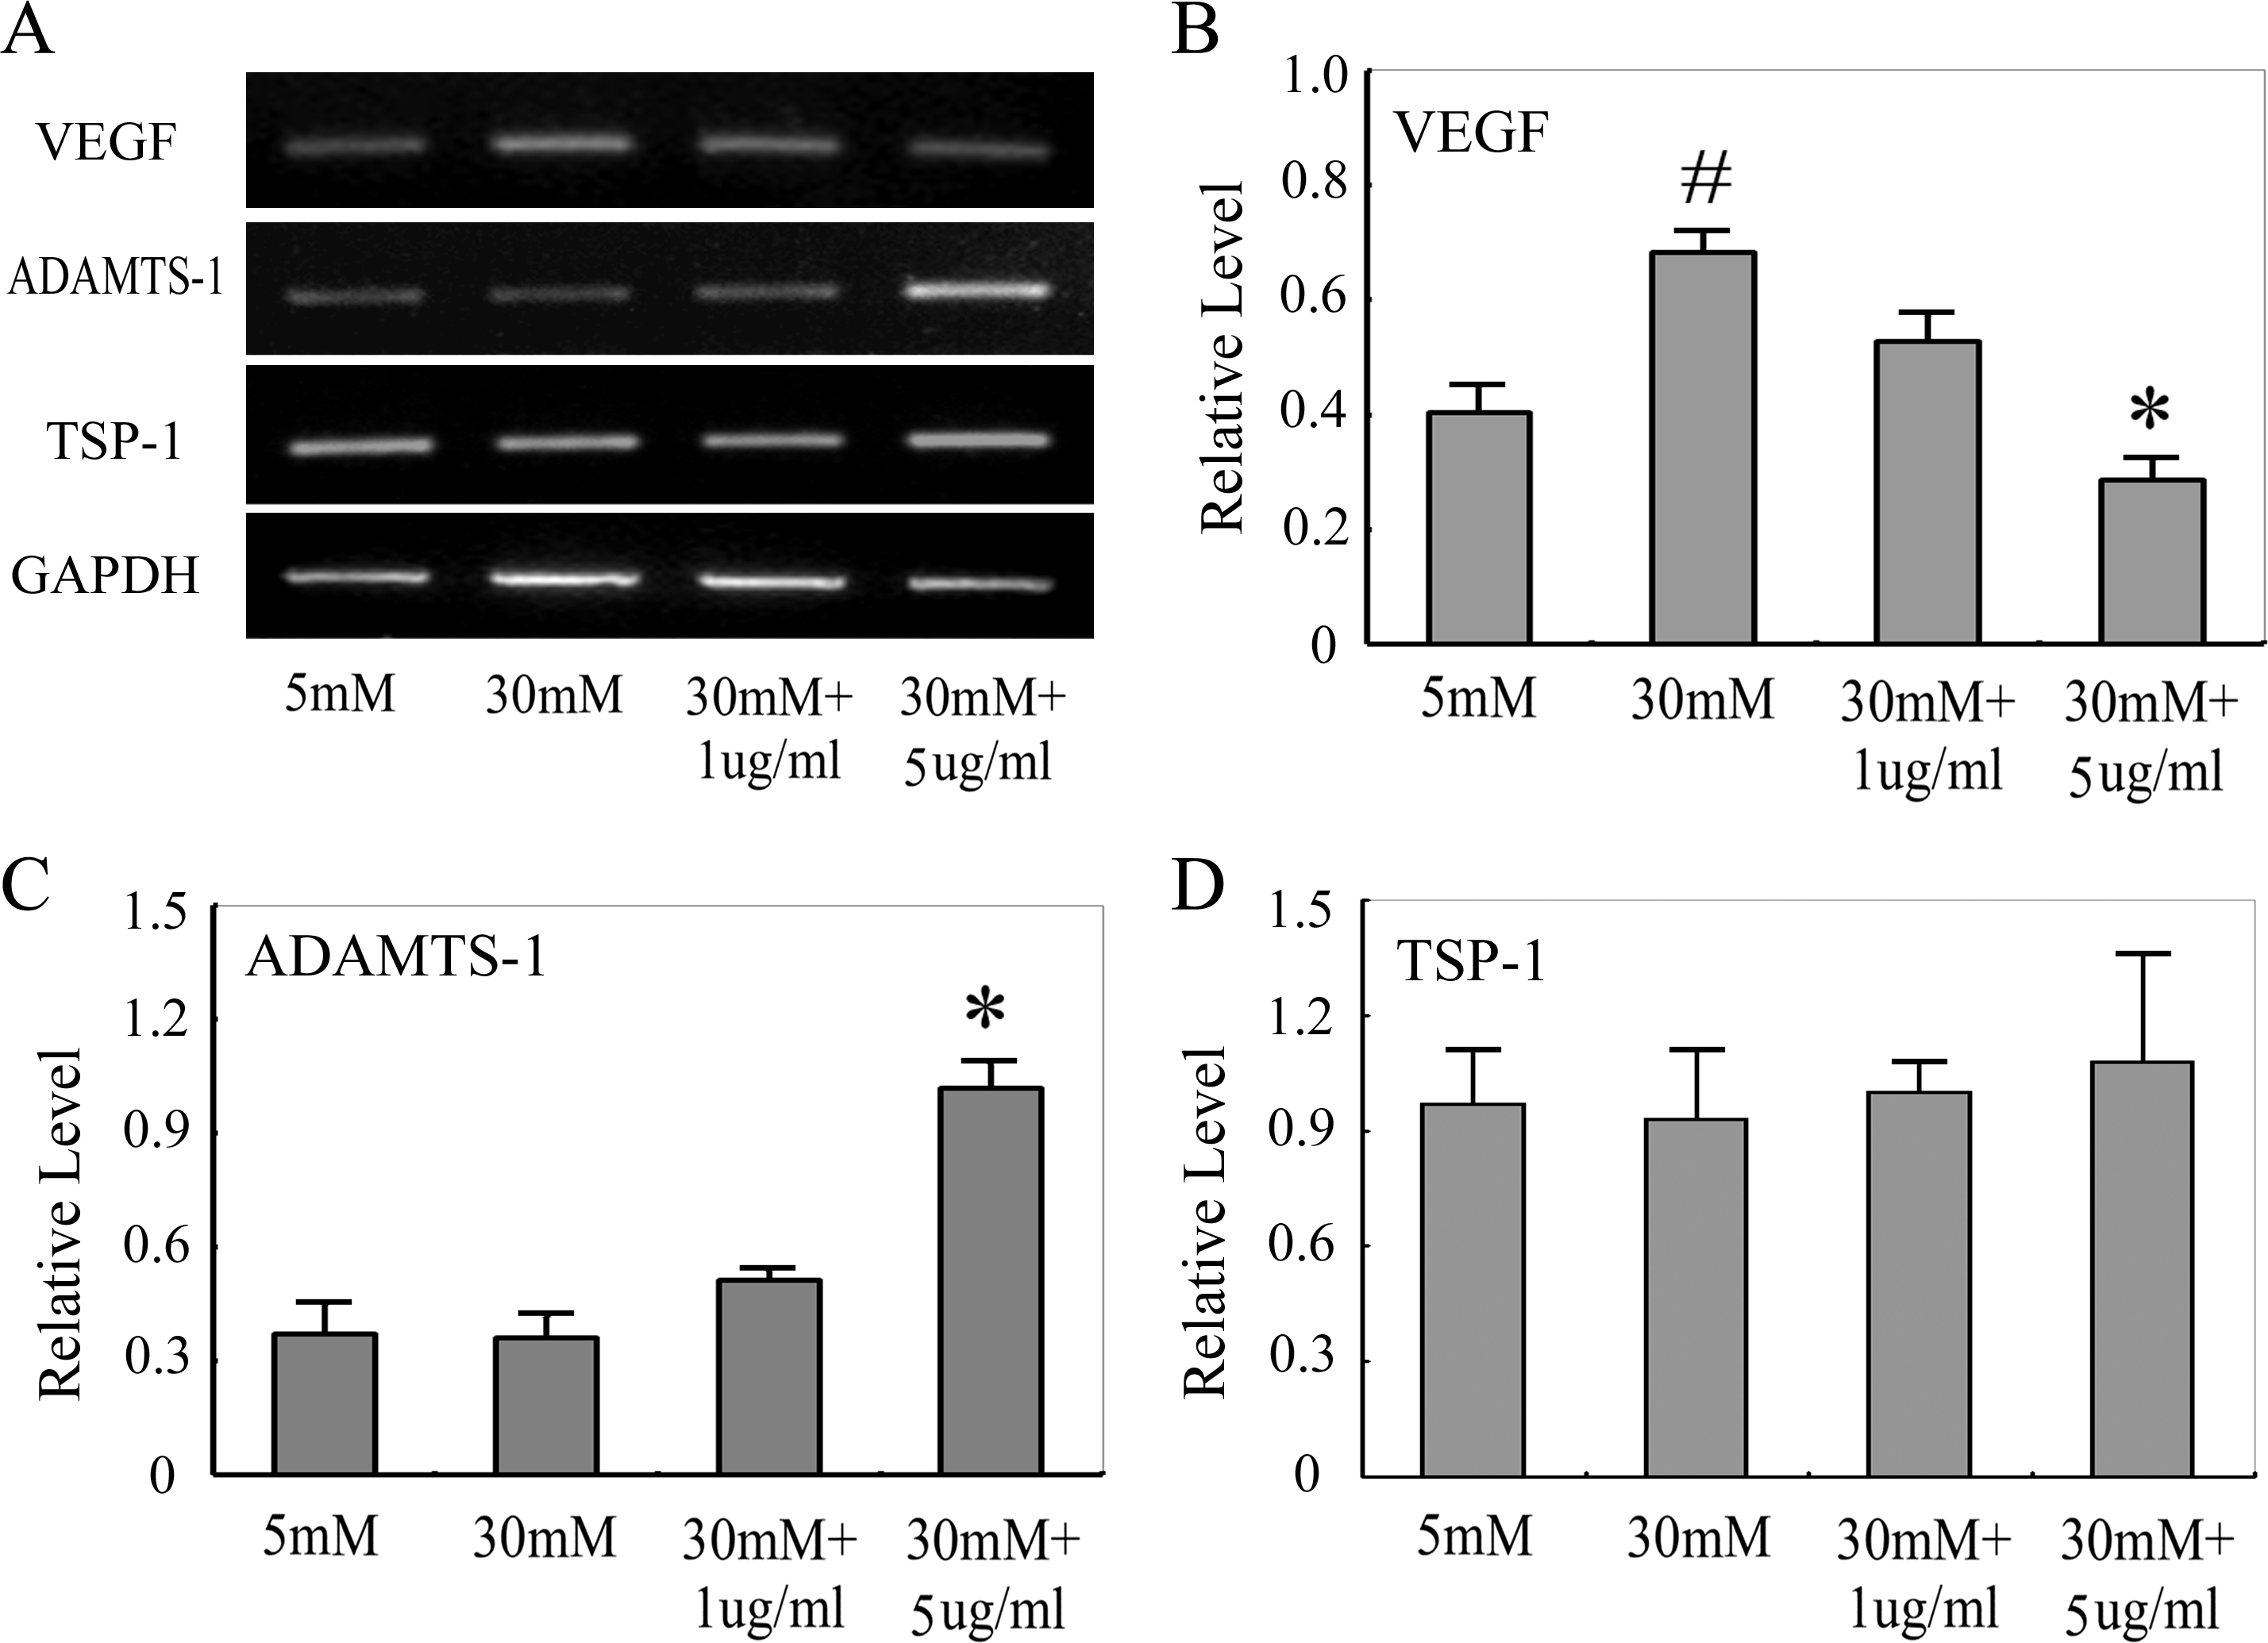
 Figure 5 of
Chen, Mol Vis 2014; 20:259-269.
Figure 5 of
Chen, Mol Vis 2014; 20:259-269.