Figure 1. High glucose promoted the expression of ADM. After HRECs were treated with different concentrations of glucose (5 mM, 15 mM,
and 30 mM) for 48 h, RT–PCR was performed to assess the mRNA expression of ADM. A: Representative results from three independent trials of RT–PCR. B: Ratios of ADM to GAPDH were determined by RT–PCR. The quantitative data of the ratio were from three independent experiments.
All values represent Mean±SD (n=3). * p<0.05 versus the 5 mM group.
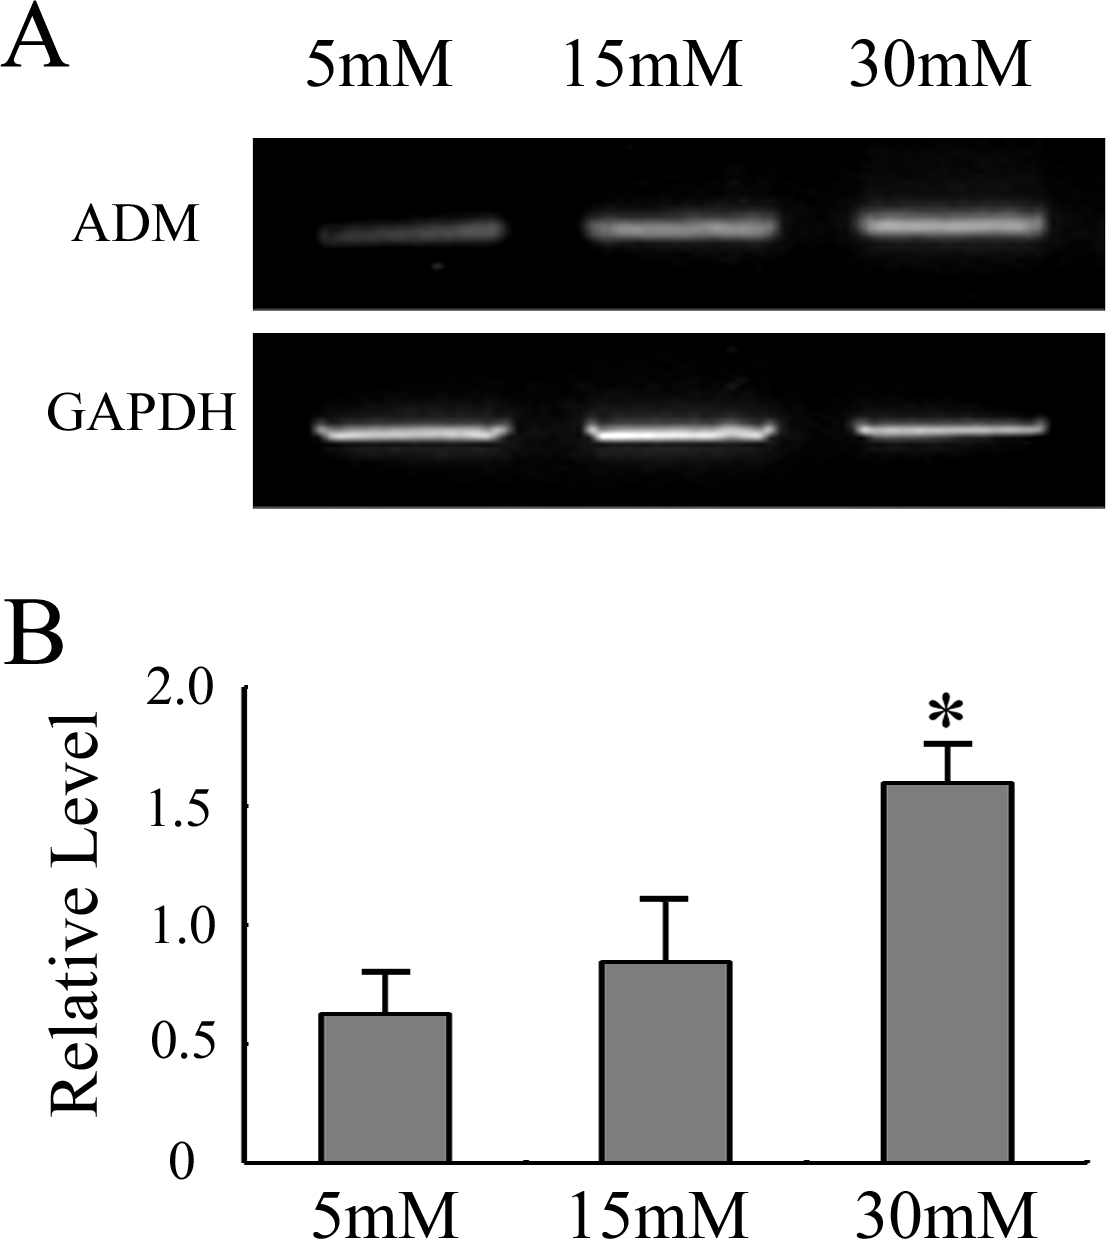
 Figure 1 of
Chen, Mol Vis 2014; 20:259-269.
Figure 1 of
Chen, Mol Vis 2014; 20:259-269.