Figure 8. Histological assessment of disease severity correlates with degree of chimerism. Linear regression of the number of pixels
in the retrolental mass (RLM) versus Arf −/− contribution, accounting for clustering of the eyes, showed good correlation for tailed-derived DNA (A) and the retinal pigment epithelium (RPE) (B) (Pearson correlation coefficients = 0.63 [p = 0.001] and 0.61 [p = 0.007], respectively), but not the cornea (C; Pearson correlation coefficient = 0.35, p = 0.101).
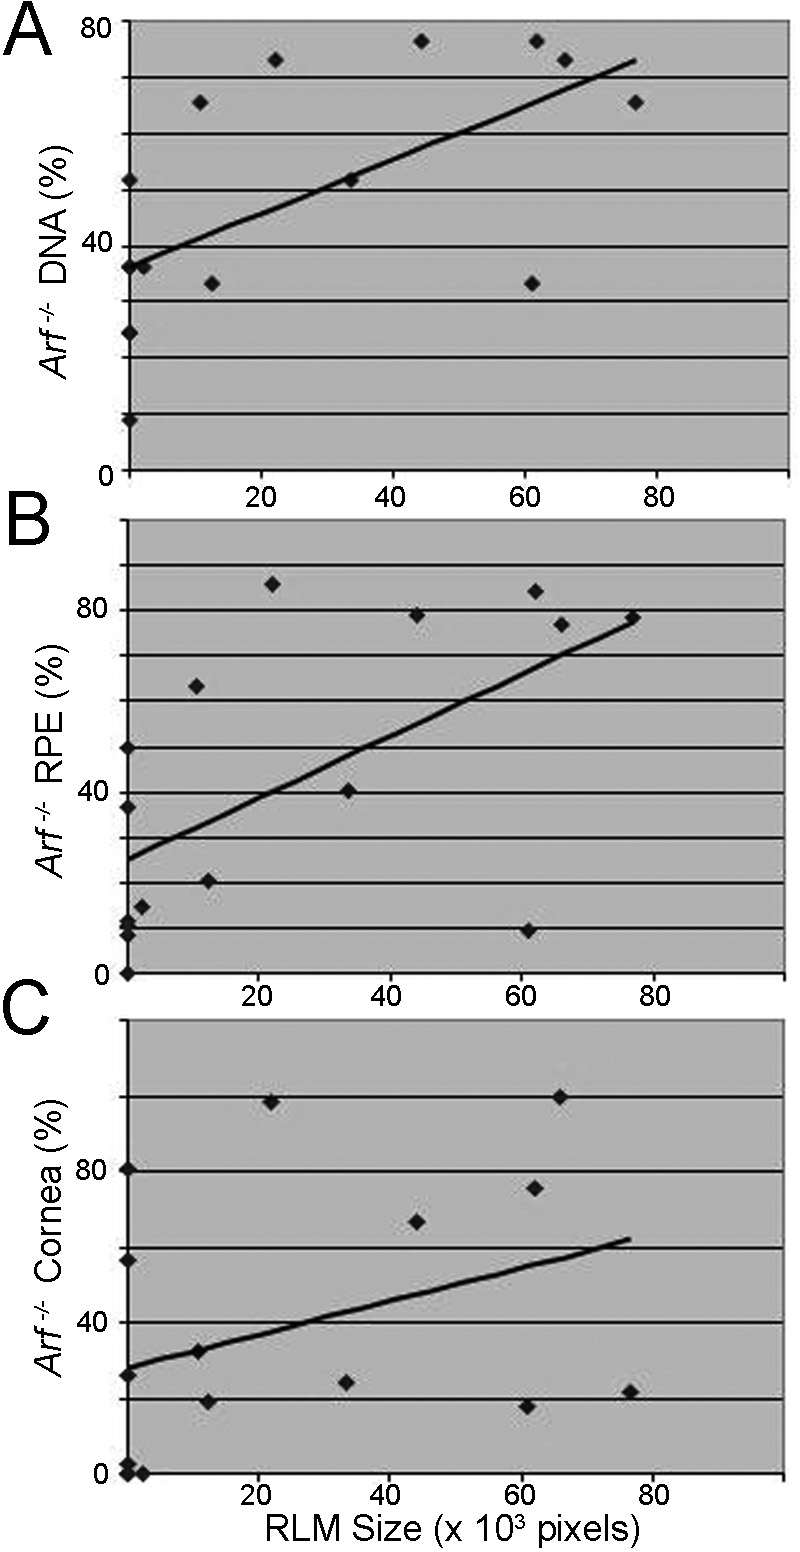
 Figure 8 of
Mary-Sinclair, Mol Vis 2014; 20:215-230.
Figure 8 of
Mary-Sinclair, Mol Vis 2014; 20:215-230.